Every parameter and its default
The complete input reference — every card on the five stage tabs and every study window, each field's shipped default, its range, and what it changes.
Every input ships with a working default, so a first run needs none of them changed. Select a boundary file, click Generate Layout, and the plant is built from the values on this page. The boundary file is the only input with no default — see Boundary files.
The inputs sit on five stage tabs under the pinned Generate Layout button: Site · Array · Electrical · Yield · Tools. Every card on a tab is a collapsible group, expanded by default. Two things change what you see: the mounting type decides which array cards appear, and the inverter topology retitles the inverter card, the transformer card and several rows. Both are chosen at launch; the ribbon's design chip ("Fixed tilt · String inverter ▾") opens another window for a different combination — see Choosing a design mode and The main window.
The tables below are in tab order, then card order, and the rows within each table follow the order of the fields on screen.
The five tabs
| Tab | Cards, in order | Changes with the design |
|---|---|---|
| Site | Input Boundary File · Site Parameters · Structures & Shadow (keep-clear) · Topography (slope-aware exclusion) | — |
| Array | MOUNTING chip · Module Specifications · MMS-Table Configuration · Spacing & Tilt | A tracker design replaces the last two with a single Tracker Configuration card |
| Electrical | String Inverter · ACCB & Transformer · Cables | A central design retitles the first card SMB – String Monitoring Box and adds one field, and retitles the second Transformer |
| Yield | Run Energy Calculation · Energy Yield | Two loss labels follow the topology |
| Tools | Obstructions · Main Control Room & Objects · Studies | — |
Inputs and the last run
The layout remembers the inputs it was generated from. Change any field on the five tabs and the layout is out of date: the button reads Regenerate Layout, the changed field turns amber, and exports and Calculate Energy are refused until you regenerate or change the value back. The exceptions are GHI and GTI, values the application fills in itself, and the ACCB & Transformer card, which regroups the plant on the spot. Tilt and pitch count only while their override is ticked, the temperature and shading losses only while they are not computed automatically. See Out-of-date results.
Site tab
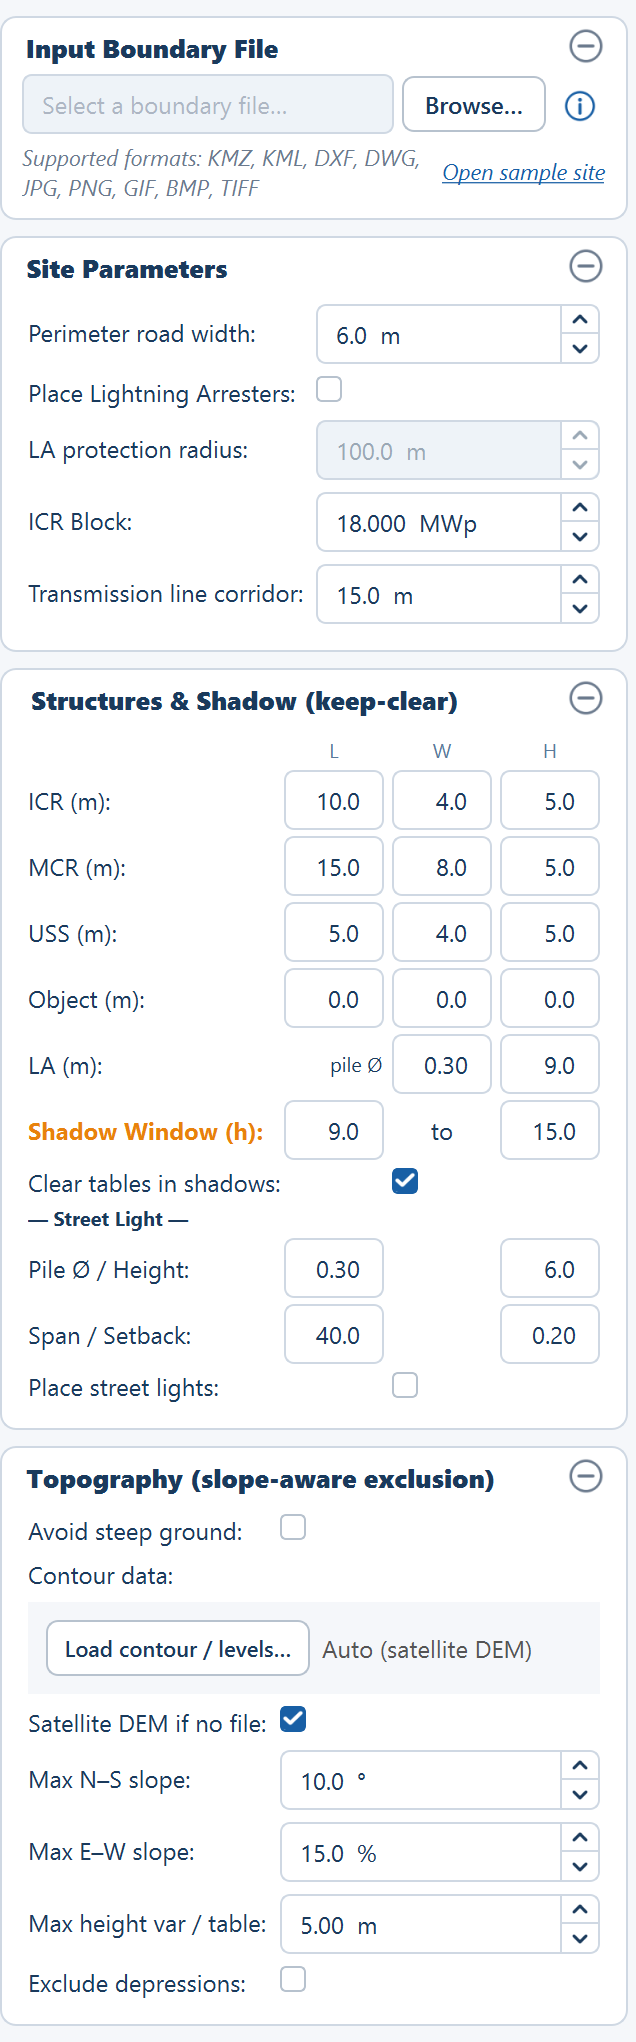
Input Boundary File
A read-only path field with the placeholder "Select a boundary file…", a Browse… button, and a round ⓘ button that opens the KMZ File Preparation Guide. Under the field a line reads "Supported formats: KMZ, KML, DXF, DWG, JPG, PNG, GIF, BMP, TIFF"; while the field is empty an Open sample site link beside it loads the bundled sample — one boundary with a pond, a transmission line and an obstruction. Once a file is read that line becomes the boundary summary, for example "1 boundary · 1 obstacle · 1 line obstruction".
| Field | Default | Range | What it does |
|---|---|---|---|
| Browse… | empty | .kmz .kml .dxf .dwg .jpg .jpeg .png .gif .bmp .tif .tiff | Chooses the file the plant boundary is read from. A CAD drawing or an image first opens the Site reference window, which asks where the drawing sits; Cancel there leaves the file unloaded. See Site reference below. |
In depth: Image boundary, and the CAD drawing page linked under Site reference.
Site Parameters
These settings decide how much ground is available before a single table is placed, and how much equipment goes on what remains. In depth: Site parameters.
| Field | Default | Range | What it does |
|---|---|---|---|
| Perimeter road width | 6.0 m | 0.0–50.0 m | Shrinks the plant boundary inward by this distance to give the usable area. Nothing is placed in the band left behind. |
| Place Lightning Arresters | off | — | On, arresters are placed on a coverage grid and the tables they overlap are cleared. Off, tables fill the whole usable area; arresters can still be added by hand in Sketch Mode. |
| LA protection radius | 100.0 m | 10.0–500.0 m | The radius one arrester is taken to protect, and the spacing of the grid they sit on. Enabled only when arresters are on. |
| ICR Block | 18.000 MWp | 0.1–500.0 MWp, three decimals | The DC capacity one inverter control room serves. Each separate piece of land needs its capacity ÷ this, rounded up, in control rooms — see the derived values. The Simulation with AC Capacity study can write its block DC here. |
| Transmission line corridor | 15.0 m per side | 0.0–500.0 m | The setback applied to each side of every line feature that is not a road, so the cleared strip is twice this figure — 30 m at the default. A road line takes half its own width each side instead. |
The corridor tooltip recommends raising the setback for higher-voltage lines, for example 30 m per side for a 400 kV line. How the control rooms are counted and placed is on Inverter control rooms.
Structures & Shadow (keep-clear)
A grid with the column headers L, W and H: Length (E-W) × Width (N-S), plus a Height that drives the shadow footprint. The compact fields carry no unit; the row labels do ("ICR (m):"). In depth: Structures and shadow.
| Field | Default | Range | What it does |
|---|---|---|---|
| ICR — L / W / H | 10.0 / 4.0 / 5.0 m | 0.0–500.0 / 0.0–500.0 / 0.0–200.0 m | The inverter control room building. Each room must fit this footprint inside the usable area, and the layout clears every table it overlaps. |
| MCR — L / W / H | 15.0 / 8.0 / 5.0 m | 0.0–500.0 / 0.0–500.0 / 0.0–200.0 m | The main control room, placed by hand once per site. |
| USS — L / W / H | 5.0 / 4.0 / 5.0 m | 0.0–500.0 / 0.0–500.0 / 0.0–200.0 m | The unit substation dropped in every plot that does not hold the MCR, on a multi-plot site. |
| Object — L / W / H | 0.0 / 0.0 / 0.0 m | 0.0–500.0 / 0.0–500.0 / 0.0–200.0 m | A generic structure you place yourself. A height of 0 means not configured. |
| LA (m) — pile Ø | 0.30 m | 0.0–5.0 m | No effect on the design. Recorded only. |
| LA (m) — height | 9.0 m | 0.0–100.0 m | No effect on the design. It casts no shadow and places nothing. |
| Shadow Window (h) | 9.0 to 15.0 | 4–12 / 12–20 solar hours | The solar-time window the keep-clear sweeps on every day of the year. A later end adds the low-sun afternoon tail and roughly doubles the ground each 5 m building sterilises. |
| Clear tables in shadows | on | — | Removes tables and tracker units falling inside the year-round shadow footprint of the ICR, MCR and objects during the window. Arresters are not in that list. |
| Street Light — Pile Ø / Height | 0.30 / 6.0 m | 0.0–5.0 / 0.0–50.0 m | Pole foundation diameter, and the pole height its shadow is cast from. |
| Street Light — Span / Setback | 40.0 / 0.20 m | 1.0–500.0 / 0.0–50.0 m | Pole-to-pole spacing along the perimeter, and how far inside the fence the poles are inset. The count is roughly the perimeter divided by the span. |
| Place street lights | off | — | On, poles are placed along the perimeter and the tables their shadow touches are cleared. |
Every length and width accepts 0.0–500.0 m and every height 0.0–200.0 m, to one decimal place, and the ranges are the same for all four structures. The two arrester fields are saved with the project, compared with the last run like any other input, and printed among the Word report's input parameters — but nothing in the layout uses them: no placement, no shadow, no quantity, no drawing.
On a multi-plot site, Place MCR drops a USS of the size above into every plot except the one holding the MCR, and each plot's control rooms route their medium-voltage cables to their own USS. The USS-to-MCR link itself is an overhead line or a buried cable handled outside the automatic routing.
Topography (slope-aware exclusion)
Does nothing until enabled. In depth: Topography.
| Field | Default | Range | What it does |
|---|---|---|---|
| Avoid steep ground | off | — | Enables the whole card. Off, no terrain exclusion is applied. |
| Contour data | "Auto (satellite DEM)" | — | The Load contour / levels… button accepts a DXF contour file drawn in the boundary file's coordinates — UTM for a KMZ or a drawing located by its own coordinates, the drawing's own coordinates for a CAD boundary placed by hand or layout only — or a CSV of longitude, latitude and elevation. A layout-only site takes the DXF only. The file dialog accepts .dxf, .dwg, .csv and .txt. |
| Satellite DEM if no file | on | — | Builds the elevation model from public satellite elevation data when no contour file is supplied. Needs an internet connection, and a known site location. |
| Max N–S slope | 10.0° | 0.0–45.0° | Ground steeper than this across the rows is excluded. |
| Max E–W slope | 15.0 % | 0.0–100.0 % | Ground steeper than this along the rows is excluded. |
| Max height var / table | 5.0 m | 0.0–30.0 m | The ground relief allowed within one table footprint — the pile-reveal differential. |
| Exclude depressions | off | — | On, hollows where water would pool are excluded as well as steep ground. |
Any terrain failure — no network, an unreadable file — is non-fatal: the layout proceeds without terrain exclusion. Contours draw green for low ground through blue to red for high, switched on by the Contour / terrain row of the Layers ▾ popover, and the excluded area is reported in acres.
Array tab
The tab opens with a read-only MOUNTING chip — "Fixed-tilt MMS tables" or "Single-axis tracker" — that records the choice made at launch.
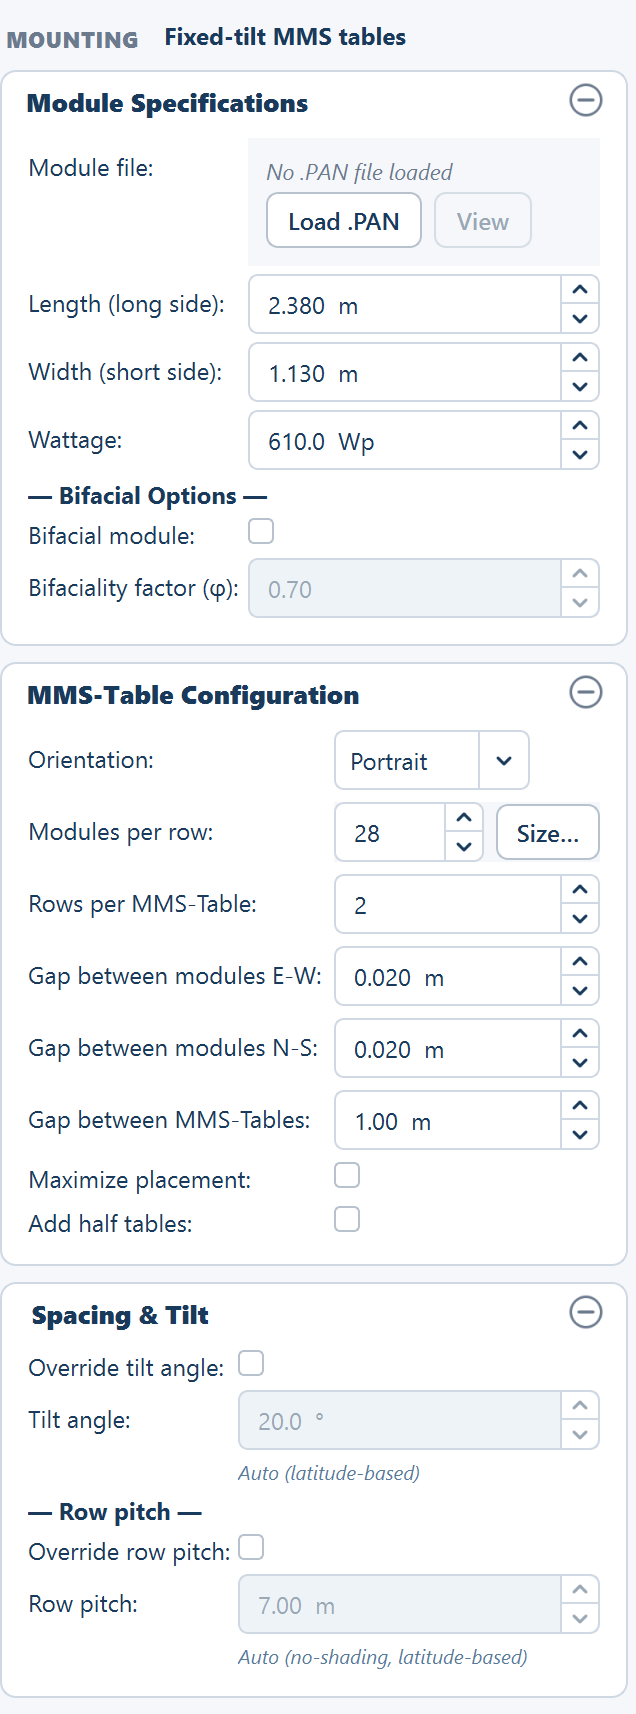
Module Specifications
Shown in both designs. In depth: Module specifications.
| Field | Default | Range | What it does |
|---|---|---|---|
| Module file | "No .PAN file loaded" | — | Load .PAN reads a PVsyst module file; View opens it read-only once loaded. |
| Length (long side) | 2.38 m | 0.5–5.0 m | The module's long edge. On fixed tilt it runs north–south in Portrait and east–west in Landscape. |
| Width (short side) | 1.13 m | 0.5–3.0 m | The module's short edge. On fixed tilt it runs east–west in Portrait and north–south in Landscape. |
| Wattage | 610 Wp | 100–1000 Wp | Nameplate DC power of one module. Plant DC capacity is this multiplied by the placed module count. |
| Bifacial module | off | — | Enables the rear-side gain model and unlocks the bifaciality factor. |
| Bifaciality factor (φ) | 0.70 | 0.50–0.95 | Rear-side efficiency as a fraction of the front. Enabled only when Bifacial module is on. |
- Load .PAN fills in the wattage, the long side and the short side. When the file declares a bifacial module it also ticks Bifacial module and fills φ, and it recomputes the temperature loss. Dimensions are accepted in metres or in millimetres. The file row then shows the module label in green.
- View opens the read-only viewer with the tabs Basic data, Sizes and technology, Model parameters, Additional data and Graphs.
- Loading a module file asks nothing. String sizing is opened from the Size… button beside Modules per row (fixed tilt) or Modules per string (N–S) (tracker) — see String sizing and the string-sizing fields below.
The bifaciality tooltip gives a typical φ of 0.65–0.80 and a typical bifacial energy gain of 5–15 % over a monofacial module.
MMS-Table Configuration
Fixed tilt only. In depth: Table configuration.
| Field | Default | Range | What it does |
|---|---|---|---|
| Orientation | Portrait | Portrait or Landscape | Decides which module edge runs east–west and which runs north–south. |
| Modules per row (with Size…) | 28 | 1–100 | Modules side by side along one row of the table, east to west. |
| Rows per MMS-Table | 2 | 1–10 | Rows of modules stacked up the tilted face. One row is one string. |
| Gap between modules E-W | 0.020 m | 0.0–5.0 m | Clear space between neighbouring modules within a row. |
| Gap between modules N-S | 0.020 m | 0.0–5.0 m | Clear space between the stacked rows on one table. |
| Gap between MMS-Tables | 1.0 m | 0.0–20.0 m | Clear space between one table and the next in the same row — east–west only; north–south spacing is the row pitch. Also the span of a standard inter-table bridge when a cleaning fleet is sized. |
| Maximize placement | off | — | Positions each row of tables independently to hug the exact boundary edge. Table columns are then not aligned across rows, and generation takes longer on a large site. |
| Add half tables | off | — | Allows a half-width table, carrying half the strings, wherever a full table will not fit. Half tables are also available in Sketch Mode. |
Table dimensions follow from the counts and the gaps:
table width  = modules per row × module E-W dimension
             + (modules per row − 1) × gap between modules E-W

table height = rows per table × module N-S dimension
             + (rows per table − 1) × gap between modules N-S
Both options at the bottom of the card are covered together on Maximize placement and half tables.
Spacing & Tilt
Fixed tilt only. Both values are derived from the site latitude unless you override them. In depth: Spacing and tilt.
| Field | Default | Range | What it does |
|---|---|---|---|
| Override tilt angle | off — the line under it reads "Auto (latitude-based)" | — | Off, the tilt is derived from the site latitude. On, your value is used. |
| Tilt angle | 20.0° | 0.0–90.0° | The fixed angle of the module plane. Enabled only when the override is on. |
| Override row pitch | off — "Auto (no-shading, latitude-based)" | — | Off, the pitch is the no-shading pitch at winter-solstice solar noon. On, your value is used. |
| Row pitch | 7.0 m | 1.0–50.0 m | Centre-to-centre spacing between rows of tables. Enabled only when the override is on. |
The automatic rules, both shown in the card's own tooltips:
tilt  ≈ latitude × 0.76 + 3.1°
pitch = L·cos(tilt) + L·sin(tilt) / tan(solar elevation)
L is the table height in the tilt plane. After a layout runs, the derived
values are reported inline — "Auto → 12.3° (latitude-based)",
"Auto → 7.42 m (no-shading, latitude-based)" — and pre-filled into the
still-greyed-out boxes so you can start from them. Reported GCR is the
table height divided by the row pitch. A CAD or image boundary continued as
Layout only has no latitude unless you typed one in Site reference;
without one, tick both overrides and set tilt and pitch by hand.
Tracker Configuration
Tracker only. This one card replaces both the table card and the spacing card; its sections are Tracker Geometry, Row Spacing and Tracker Parameters. In depth: Tracker configuration.
| Field | Default | Range | What it does |
|---|---|---|---|
| No. of strings per tracker | 2 | 1–20 | Strings carried end to end along one tracker unit. |
| Modules across tracker (E–W) | 1 | 1–8 | Modules side by side across the torque tube. Sets the aperture. |
| Module orientation | P config (Portrait) | P or L config | P config puts the module long side east–west. L config (Landscape) puts the long edge north–south along the torque tube. |
| Modules per string (N–S) (with Size…) | 28 | 4–120 | Modules in series along the tube per string. The tooltip gives a typical range of 14–30. |
| Gap between modules E–W | 0.020 m | 0.0–5.0 m | Clear space between modules across the tube. |
| Gap between modules N–S | 0.020 m | 0.0–5.0 m | Clear space between modules along the tube. |
| Tracker E-W pitch | 5.5 m | 1.0–30.0 m | Centre-to-centre spacing between tracker columns. Divides into the aperture to give GCR. The tooltip gives a typical range of 4.5–7 m. |
| N–S service gap between units | 2.0 m | 0.0–20.0 m | Clear space between one tracker unit and the next along the same column. |
| Max rotation angle (±) | 55.0° | 5.0–75.0° | The rotation limit either side of horizontal. A reference and shading-analysis input. |
| Tracker height from ground | 1.5 m | 0.5–10.0 m | Torque-tube height. A reference and shading-analysis input. |
| Maximize placement | off | — | Positions each column independently to hug the boundary edge. |
| Add half trackers | off | — | Allows a half-length unit wherever a full one will not fit. |
The unit dimensions as placed:
n along tube    = strings per tracker × modules per string
aperture (E-W)  = modules across × module E-W dimension
                + (modules across − 1) × gap between modules E–W
length (N-S)    = n along tube × module N-S dimension
                + (n along tube − 1) × gap between modules N–S
modules/tracker = modules across × strings per tracker × modules per string
N-S step        = length + N–S service gap
A green preview line under the card reports Aperture (E-W), Length (N-S), GCR and Modules/tracker as you type. Treat it as indicative: it leaves the module gaps out of the first two, so on the shipped defaults the previewed length is 1.10 m short of the placed one.
The east–west pitch has a silent floor. A pitch at or below the aperture is raised to the aperture plus 0.5 m without a warning, and the reported GCR uses that effective pitch.
Electrical tab
String Inverter, or SMB – String Monitoring Box
The card title and the row labels follow the topology: String Inverter in a string design, SMB – String Monitoring Box in a central design. In depth: Inverters.
| Field | Default | Range | What it does |
|---|---|---|---|
| Max strings per inverter (string) / Max strings per SMB (central) | 20 | 1–500 | How many strings one inverter or one string monitoring box accepts. One string is one row of modules within an MMS-Table. |
| Max SMB per Central Inverter (central only) | 10 | 1–200 | How many boxes feed one central inverter. The central inverter's capacity is the box capacity multiplied by this. |
| OND (inverter) | "No OND file loaded" | — | Load .OND reads a PVsyst inverter file; View opens it read-only once loaded. |
- Load .OND shows the manufacturer and model on the row. Its AC power rating, multiplied by the inverter count, gives the plant's inverter capacity and AC capacity. Loading it does not set the inverter efficiency on the Yield tab.
- The same file feeds the next card: PmaxOut sets the transformer loads and the power transformer, the output voltage sets the LV voltage, and the maximum AC current sets the inverter feeder current in the cable schedule. Loading it after a layout regroups the plant at once and marks the layout out of date.
- View opens the read-only viewer with the tabs Main parameters, Efficiency curve, Additional parameters, Output parameters and Sizes and technology.
- In a central design the central inverters are counted per ICR block — the block's boxes ÷ Max SMB per Central Inverter, rounded up, at least one and at most 4 in one control room building.
ACCB & Transformer, or Transformer
The second card groups each ICR block's inverters into AC combiner boxes (ACCBs) and the ACCBs into transformers, and sizes the power transformer at the main control room. It is titled ACCB & Transformer in a string design and Transformer in a central design, where central inverters feed the transformers directly. In depth: ACCB and transformers.
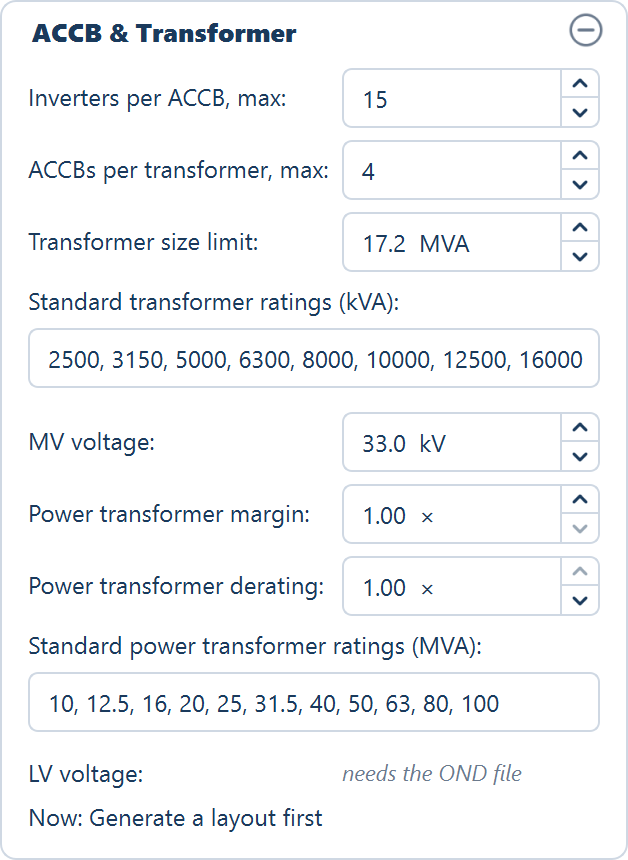
| Field | Default | Range | What it does |
|---|---|---|---|
| Inverters per ACCB, max: (string) | 15 | 1–60 | Most string inverters on one ACCB. Each ICR block gets its own ACCBs, the inverters shared evenly. |
| ACCBs per transformer, max: (string) | 4 | 1–12 | Most ACCBs on one transformer; each takes one LV winding. |
| Central inverters per transformer, max: (central) | 4 | 1–12 | Most central inverters on one transformer; each takes one LV winding. |
| Transformer size limit: | 17.2 MVA | 0.5–100.0 MVA | The largest transformer allowed; a block whose load is bigger gets more transformers. Never above the largest listed rating — 16,000 kVA with the default list. |
| Standard transformer ratings (kVA): | 2500, 3150, 5000, 6300, 8000, 10000, 12500, 16000 | a list | Each transformer takes the smallest rating at or above its load. |
| MV voltage: | 33.0 kV | 0.4–400.0 kV | The transformers' MV side, as printed in the transformer text, the BOM, the automatic diagram and the ICR block figures. The cable schedule works at 33 kV whatever this reads. |
| Power transformer margin: | 1.00 × | 1.00–3.00 × | Multiplies the plant's maximum AC — every inverter at PmaxOut — before the power transformer is rated. |
| Power transformer derating: | 1.00 × | 0.50–1.00 × | Below 1.00 for a site above about 40 °C ambient or 1,000 m altitude; the power transformer then needs a higher rating for the same load. |
| Standard power transformer ratings (MVA): | 10, 12.5, 16, 20, 25, 31.5, 40, 50, 63, 80, 100 | a list | The power transformer takes the smallest rating at or above the plant's need; above the largest, as many transformers as that needs. |
| LV voltage: | "needs the OND file" | read-only | The inverter file's output voltage, e.g. "800 V · from the OND". |
- Rating lists take commas, semicolons or spaces, and are read when you press Enter or leave the field; the list is then sorted, duplicates dropped and rewritten tidily. An invalid list keeps the previous ratings, with a hint under the field such as "List at least one rating. Keeping 2500, 5000."
- The answer line at the foot of the card reads "Now: Generate a layout first" until a layout exists, then, for example, "Now: 12 ACCBs · 4 transformers: 4 × 16,000 kVA", or "… · ratings need the OND file" without an inverter file.
- An edit regroups every plot at once, without a Generate. Nothing is re-placed or re-routed, the layout does not go out of date, and the Summary view follows. A stored automatic diagram is not redrawn — choose Automatic again in the SLD view — and the next visit to the BOM view recomputes the list, discarding hand edits.
- The power transformer exists only when a plot holds a main control room and an inverter file is loaded. It carries every inverter on the site — central inverters in a central design — because the other plots feed through their unit substations:
need  = inverters × PmaxOut (kW) ÷ 1000 × margin ÷ derating   (MVA)
count = the larger of 1 and need ÷ largest listed rating, rounded up
Each unit then takes the smallest listed rating at or above need ÷ count.
Cables
The third card. In depth: Cable options.
| Field | Default | Range | What it does |
|---|---|---|---|
| Calculate cables | off | — | Routes and measures the string DC cables and the AC cables (or the DC trunks to the central inverter, counted twice for the two conductors). Off, the inverter and box counts are still computed and every cable row reads —. |
| Inter-module lead | 0.00 m/module | 0.00–2.00 m/module | Extra string cable per module for the inter-module leads, counted once per string. It ships at 0 because the module supplier provides these leads. Fixed-tilt tables only. |
| String return run along table | off | — | Tick for daisy-chain wiring: the string's two leads end at opposite ends of the table, so one conductor runs back along the table to exit beside the other. Leave off for leapfrog wiring, whose leads exit the same end. Fixed-tilt tables only. |
| DC cable slack | 10.0 % | 0.0–30.0 % | Slack and wastage added to every DC string-cable total, trackers included. |
The lead and the return run add nothing on a tracker design; the slack applies to both.
Ticking Calculate cables raises Cable Calculation — Performance Notice: cable calculation can take a long time on large or complex layouts. The buttons are Enable Now and Not Now (Recommended), and the recommendation is the default: generate the layout first without cables, review it, then enable them for the final run. Reopening a project does not raise it.
Yield tab
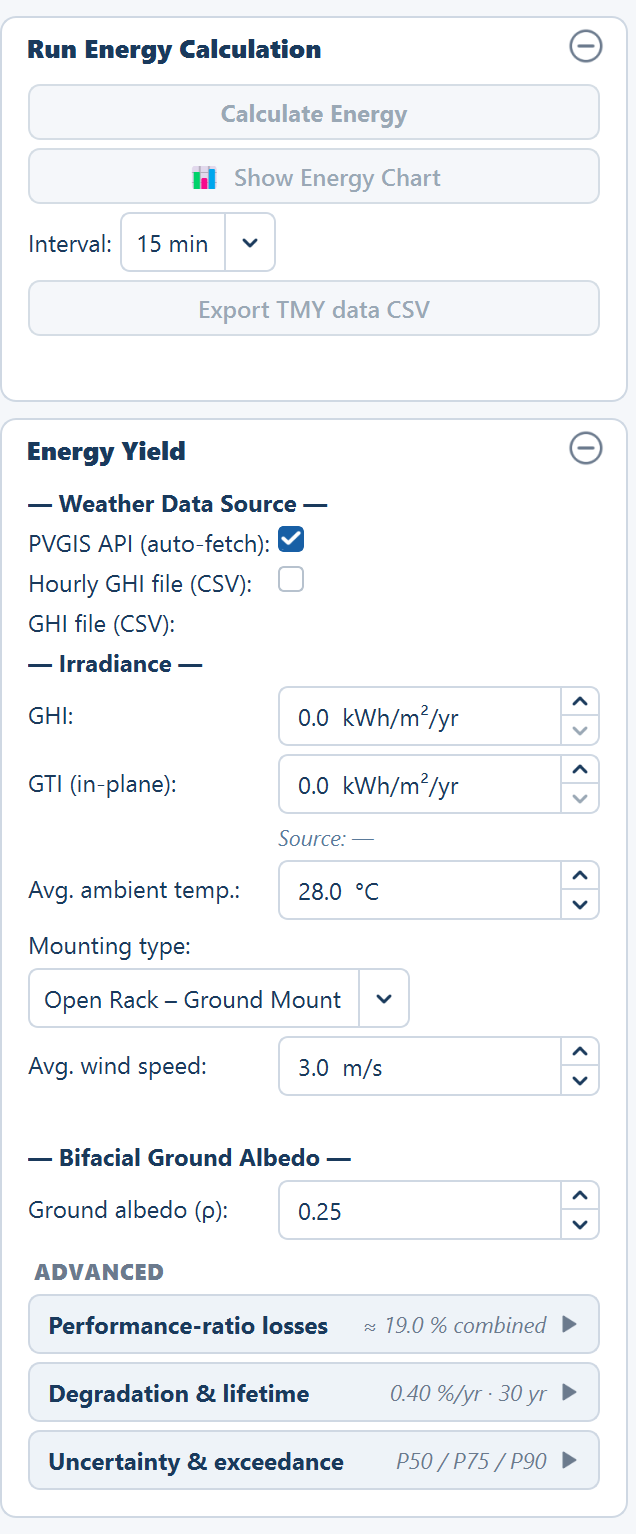
Run Energy Calculation
Not inputs, but the card the tab opens with: Calculate Energy, 📊 Show Energy Chart, an Interval: selector (1 min, 10 min, 15 min, 30 min, 1 hour) for the time-series export, Export TMY data CSV, and a status line. All are disabled until a layout exists, and Calculate Energy is also disabled while the layout is out of date and on a site whose location is unknown. In depth: How yield is calculated and Time series.
Energy Yield
Nothing here affects where a table goes — it decides what the placed plant is predicted to generate. Its fields are still inputs to the last run — GHI and GTI aside — so changing a loss makes the layout out of date.
Weather Data Source
Two mutually exclusive tick boxes. In depth: Weather data.
| Option | Default | What it does |
|---|---|---|
| PVGIS API (auto-fetch) | selected | Fetches irradiance for the site from the EU Joint Research Centre service when you calculate energy. No key or account. Falls back to NASA POWER where PVGIS has no data. |
| Hourly GHI file (CSV) | — | Reveals a GHI file (CSV): row with Browse… for your own hourly weather file. |
Selecting the file option pops Hourly GHI File — Required Format: exactly 3 columns in order — an hourly timestamp, GHI in W/m², and ambient temperature in °C. A full year is 8 760 rows, and a header row is optional and detected automatically. The application accepts more than that reminder suggests — column names are matched flexibly, and an in-plane irradiance column is accepted as well:
| Quantity | Accepted column names |
|---|---|
| Time | time, datetime, date, timestamp, time(utc), time(local), date/time |
| GHI | ghi, g(h), gh, global_horizontal, global horizontal irradiance, irradiance, solar irradiance, allsky_sfc_sw_dwn |
| GTI | gti, g(i), gi, in-plane irradiance |
When the file carries a temperature column, monthly average temperatures come from the file instead of from the seasonal model.
Irradiance and site conditions
| Field | Default | Range | What it does |
|---|---|---|---|
| GHI | 0.0 kWh/m²/yr | 0–3000 kWh/m²/yr | Annual global horizontal irradiance. Filled automatically once weather data is fetched or read. |
| GTI (in-plane) | 0.0 kWh/m²/yr | 0–3500 kWh/m²/yr | Annual irradiance on the tilted module plane. Filled automatically, and the figure the yield is built from. |
| (source line) | "Source: —" | — | Reads "Source: PVGIS (EU JRC) — auto fetched", "Source: NASA POWER — auto fetched" or, in red, "Source: Auto-fetch failed — switch to GHI file". |
| Avg. ambient temp. | 28.0 °C | −10–55 °C | Site air temperature used by the module temperature model. |
| Mounting type | Open Rack – Ground Mount | 4 options | Selects the Sandia thermal coefficient pair below. |
| Avg. wind speed | 3.0 m/s | 0.5–15.0 m/s | Site wind speed used by the module temperature model. |
| Ground albedo (ρ) | 0.25 | 0.05–0.80 | Reflectance of the ground. It feeds only the rear-side gain of a bifacial module; it has no effect on a monofacial one. See Bifacial gain. |
The four mounting configurations and their coefficient pairs:
| Mounting type | a | b |
|---|---|---|
| Open Rack – Ground Mount | −3.56 | −0.075 |
| Roof Mount – Close | −2.81 | −0.0455 |
| Stand-off Mount | −3.23 | −0.130 |
| Insulated Back | −2.81 | −0.0455 |
They feed the module temperature, and through it the temperature loss:
T_module = T_ambient + G × exp(a + b × W)
Loss (%) = |μPmpp| × (T_module − 25)
W is the wind speed and μPmpp is the module's power temperature coefficient,
read from the module file. G is the average operating irradiance derived from
GTI as the smaller of 900 W/m² and GTI × 1000 / (365 × 8), or 600 W/m² when
GTI is still 0. Once a module file is loaded a formula trace under the wind
speed shows the working. See Temperature losses.
ADVANCED expanders
Three expanders, collapsed by default, each header carrying a live summary.
Performance-ratio losses (summary "≈ 19.0 % combined" on the defaults). Every loss is a percentage, and together they give the performance ratio the yield is multiplied by. In depth: Losses and performance ratio.
| Field | Default | Range | What it does |
|---|---|---|---|
| String Inverter efficiency (string) / Central Inverter efficiency (central) | 97.0 % | 50–100 % | Conversion efficiency of the inverter. The label follows the design; loading an inverter file does not change it. |
| String DC cable losses — (MMS → SMB) in a central design | 1.0 % | 0–20 % | Resistive loss on the DC run out of the tables. |
| AC cable losses (Str. Inv. → ICR) — DC cable losses (SMB → Central Inv.) in a central design | 1.0 % | 0–20 % | Resistive loss on the second leg: AC to the control room, or the DC trunk to the central inverter. |
| Soiling losses | 2.0 % | 0–20 % | Dust, dirt and bird droppings on the glass. |
| Temperature losses | 6.0 % | 0–20 % | Loss from the modules running above 25 °C. Computed automatically once a module file is loaded; the read-only Module temp. (Sandia) line under it shows the working. |
| Module mismatch | 1.0 % | 0–10 % | Loss from modules in a string not being electrically identical. |
| Shading losses | 1.0 % | 0–20 % | Row-to-row shading. Greyed out while the auto-compute below is on. |
| Auto (row-to-row, GCR) | on | — | Derives the shading loss from the plant's GCR on Generate Layout; the line under it then reads "Auto → 1.23% (row-to-row, computed)", or "Auto → — (needs the site's latitude)" on a layout-only site with no latitude. See Shading. |
| Module ground clearance | 0.5 m | 0.0–5.0 m | Height of the module's lower edge above the ground. It feeds the Shadow View cross-section only, not the computed loss. |
| Availability | 99.0 % | 50–100 % | Fraction of the year the plant is available to generate. |
| Transformer losses | 1.0 % | 0–10 % | Loss in the step-up transformer. |
| Other losses | 2.0 % | 0–10 % | Monitoring, auxiliary and miscellaneous consumption. |
Degradation & lifetime (summary "0.40 %/yr · 30 yr"). In depth: Lifetime and P-values.
| Field | Default | Range | What it does |
|---|---|---|---|
| 1st year degradation | 1.0 % | 0–10 % | The initial drop in output over the first year of exposure, applied once. |
| Annual degradation | 0.4 %/yr | 0–5 %/yr | Compounding output loss applied from year 2 onward. |
| Plant lifetime | 30 years | 1–50 years | How many years the lifetime total runs for. |
Year 1 (actual) = capacity (kWp) × specific yield × (1 − 1st year degradation)
Year n (n ≥ 2)  = Year 1 (actual) × (1 − annual degradation)^(n−1)
Uncertainty & exceedance (summary "P50 / P75 / P90"). The three probability rows of the Summary view are named from these fields, so read the row label rather than assume P50, P75 and P90.
| Field | Default | Range | What it does |
|---|---|---|---|
| Combined uncertainty (1σ) | 5.0 % | 0.1–30.0 % | One standard deviation of the combined yield uncertainty. Drives all three exceedance figures. |
| Exceedance prob. 1 | 50.0 % | 1.0–99.9 % | First probability row. |
| Exceedance prob. 2 | 75.0 % | 1.0–99.9 % | Second probability row. |
| Exceedance prob. 3 | 90.0 % | 1.0–99.9 % | Third probability row. |
The tooltips give the two standard cases:
P75 = P50 × (1 − 0.674 × σ)
P90 = P50 × (1 − 1.282 × σ)
Tools tab
No parameters of its own — this tab edits the generated layout and opens the studies. It can be opened at any time; before a layout its tooltip reads "Generate a layout first" and its buttons are greyed out, except Robot count from DXF…. Its cards are Obstructions (Draw Rectangle, Draw Polygon, Undo Last, Clear All), the tip "Tip: Click and drag a blue ICR to reposition it." once a run has placed control rooms, Main Control Room & Objects (Place MCR, Remove MCR, Place Object, Remove Objects) and Studies, whose five buttons are, in order:
- 🔆 Simulation with AC Capacity
- 🤖 Robotic Module Cleaning
- Robot count from DXF…
- 🌓 Shadow View (row spacing)
- ⚡ Earthing Design
Robot count from DXF… and Earthing Design… are also on the Tools menu. See Obstructions and Site equipment; the studies' own inputs are in the next section.
Parameters set outside the input panel
Seven windows carry their own inputs, with defaults of their own.
Site reference
Opens when you choose a CAD drawing or an image with Browse…. Nothing is pre-filled. The choice and the image scale are saved in the project and reused at every Generate. In depth: CAD drawing.
| Field | Default | Range | What it does |
|---|---|---|---|
| SCALE (images only) — "[100.00 m] on site is drawn as [10.00 mm]" | 100 m / 10 mm | site 0.1–1 000 000 m; drawing 0.01–100 000 mm | The scale the image is traced at. |
| LOCATION | the first mode offered | Drawing's coordinates (a CAD drawing whose coordinates look like UTM only) · Place by latitude and longitude · Layout only | Says where the drawing sits. |
| UTM zone + North / South (Drawing's coordinates) | none — pick one | Zone 1–60 | The zone the drawing was made in. A zone declared in the drawing is used as it is. |
| Latitude / Longitude (Place by latitude and longitude) | empty | −90–90 / −180–180° | The centre of the site boundary. The drawing is moved there, never scaled or rotated. |
| Latitude (Layout only) | empty — optional | −90–90° | Used for automatic tilt and row pitch only. |
Layout only leaves the location unknown: no energy yield, no KMZ, no satellite imagery, and — without a latitude — no automatic tilt, row pitch or building-shadow clearance.
String sizing
Opened from Size…. It needs a module file and an inverter file. In depth: String sizing.
| Field | Default | Range | What it does |
|---|---|---|---|
| System voltage | 1500 V | 1000, 1100, 1500 or 2000 V (editable) | The hard insulation limit the cold-day open-circuit voltage must stay under. |
| Coldest day | −5.0 °C | −40–40 °C | Sets the cold-case voltages, and so the maximum string length. |
| Hottest day | 45.0 °C | 10–70 °C | Sets the hot-case operating voltage, and so the minimum string length. |
| Model | Sandia (wind-based) | Sandia (wind-based) or NOCT model | How cell temperature is derived from ambient. |
| Wind speed | 3.0 m/s | 0–15 m/s | Sandia only. |
| NOCT | from the module file | 30–60 °C | NOCT model only; marked estimated when the file carries none. |
| Irradiance, hot case | 1000 W/m² | 100–1200 W/m² | The irradiance the hot-case cell temperature is evaluated at. |
| Coefficient | the file's Voc coefficient, else −0.28 %/°C | −1.0 to −0.05 %/°C | Under the Override voltage temperature coefficient expander; applied to both Voc and Vmp. |
| Modules in series / Modules per string | the largest feasible string | 1–200 | The pick, written back to the panel by Use this string. |
| Parallel strings per table / Strings per tracker | — | 1–200 | The second value written back. |
Simulation with AC Capacity
Needs a module file and an inverter file. In depth: Sizing from an AC capacity.
| Field | Default | Range | What it does |
|---|---|---|---|
| AC capacity | the largest multiple of 100 kW that fits the layout's DC at a ratio of 1.30 | 1.0–5,000,000 kW | The target the inverter count is sized to, never under-sized. |
| DC/AC ratio | 1.30 | 0.80–2.50 | Target DC is the requested AC multiplied by this. |
| Overload limit | 1.5 (string) / 1.4 (central) | 1.00–2.00 | The design overload limit, not the inverter's nameplate DC input. A ratio above it is clipped to it. |
| Modules per string (with Size…) | the panel's Modules per row (fixed tilt) or Modules per string (N–S) (tracker) | 1–200 | The series count the strings are built from. |
| Module Pmax · Inverter rated AC (under Override nameplate values) | the module file's and the inverter file's nameplate values | 0–2000 W · 0–100,000 kW | The nameplate figures the simulation uses. |
| ICR block AC | Not set (0), every time the window opens | 0–5,000,000 kW, step 100 | The AC capacity one ICR block serves. Set, the block DC is this × the ratio, and Regenerate writes it into ICR Block, rounded up to three decimals. Not set keeps the panel's ICR Block. |
| Strings per SMB (central only) | 20 | 1–500 | Boxes per inverter follow from it. Enabled only when the target fits the layout. |
| Let me choose where placement starts | off | — | After regenerating, click a point on the plot; the tables nearest it are kept. |
Robotic module cleaning
Sizes the fleet for the generated layout. In depth: Robotic module cleaning.
| Field | Default | Range | What it does |
|---|---|---|---|
| Travel per charge | 0 m — no limit | 0–100,000 m | How far a robot goes on one charge. |
| Standard bridge span | the configured gap — Gap between MMS-Tables (1.0 m) on fixed tilt, N–S service gap between units (2.0 m) on a tracker; 2.0 m if that is zero | 0–50 m | The widest gap a standard bridge spans. |
| Skip lines up to | 0 | 0–1,000, steps of 0.5 | A segment carrying this many units or fewer gets no robot; a half unit counts 0.5. |
| Out and back | on | — | The robot must return on the same charge, doubling the distance to cover. |
Nothing is bridged unless you tick it in the list of gaps. The fleet result is saved with the project; the window's own answers are not, and it opens on the defaults every time.
Robot count from DXF
Sizes a cleaning fleet from any plant layout DXF, with no layout generated, and writes nothing into the project. In depth: Robot count from DXF.
| Field | Default | Range | What it does |
|---|---|---|---|
| Structure | read from the drawing (Fixed tilt · auto / Single-axis tracker · auto) | Fixed tilt or Tracker | Changes the wording only, never the count. |
| Travel per charge | 0 m — shown as no limit | 0–100,000 m, step 50 | How far a robot goes on one charge. |
| Standard bridge span | the drawing's most common gap between tables, to 0.1 m; 2.0 m if the drawing has none | 0–50 m | The widest gap a standard bridge spans. Reset on every new file. |
| Skip lines up to | 0 | 0–1,000, step 0.5 | A line or segment carrying this many units or fewer gets no robot; a half unit counts 0.5. |
| Out and back | on | — | The robot must return on the same charge, doubling the distance to cover. |
The Layers view assigns each layer of the drawing a role, guessed from its name; only the tables layer is required.
Earthing Design
A preliminary IEC earthing calculation for the generated layout, with IS 3043 and IEEE 80 shown as cross-checks. There is no run button: the window calculates when it opens and again as you edit. Its inputs are not saved in the project; they are remembered only while the application window stays open. The fields, their defaults and what each one drives are on Earthing design. The inputs are in seven groups, in this order:
| Group | What it sets |
|---|---|
| Soil & site | Soil resistivity (100.0 Ω·m) and the season factor (1.50) that give the design resistivity, the gravel layer, the corrosion allowance and the design life |
| Fault data | The LV and MV fault currents and times (5.0 kA and 25.0 kA, 1.00 s each), the MV neutral, the report-only HV duty, and the touch / step duration, split factor and X/R |
| Targets | Whole plant (1.00 Ω), Each earth pit (5.0 Ω), LA earth pit (10.0 Ω) and the pit rule |
| Earth pit (maintenance-free) | Electrode length (3.0 m), rod and bore diameters, backfill resistivity, pit spacing and strip depth |
| Conductors | The initial and final temperatures (30 → 300 °C), the GI strip and Cu cable size lists, and wastage (5 %) |
| Equipment rules | Pits per ICR, USS, MCR, transformer neutral and arrester; fence, gate, CCTV and weather-station pits; frame bonding and tracker jumpers |
| Layout rules | Strip in the AC and MV trenches, and the link, runner-split and cross-link lengths |
Pile layout
Opened from Piles: OFF or Edit-Pile ▸ Define Pile Layout…. In depth: Piles.
| Field | Default | Range | What it does |
|---|---|---|---|
| Full / Half switch | Full | Full table · Half table (tracker wording on a tracker) | Chooses which pattern you are editing. Shown only when the plant has half units. |
| Auto grid… — Piles per row | 4 | 1–100 | Piles along X (east), evenly spaced and inset 6 % from the ends. |
| Auto grid… — Rows of piles | 2 | 1–100 | Rows along Y (north), inset 10 % from the sides. Replaces the piles placed so far on the current tab's unit. |
| Pile radius | 0.15 m | 0.01–2.0 m | The circle each pile is drawn as. One radius for full and half units. |
Full tables carry the full pattern. Half tables carry a half pattern — derived from the full one by default (same end overhangs, even spans, and on a tracker a drive pile at the centre), or your own once you edit it on the Half tab; Reset to derived returns to the derived one. Offsets are measured from the unit's own south-west corner. The patterns are saved with the project and carried across a Generate; the overlay's ON / OFF is not saved.
What a project file keeps
A saved .slp project keeps every input on the five stage tabs:
- Boundary and location: the boundary file path, the Site reference choice and the image scale.
- Files: the paths of the module, inverter, hourly weather and contour files — kept even when a file has gone missing.
- Array, Site, Electrical and Yield: every field on this page, including Structures & Shadow, Topography, the three cable allowances, Maximize placement, half tables, the Place Lightning Arresters tick, the shading auto-compute tick, ground clearance and the ACCB & Transformer card's rules.
- Pile patterns: full, half and the radius.
It also keeps the layout, the control rooms, inverters and cables, the MCR, USS and objects, drawn obstructions, sketch elements and hand-drawn trenches, the terrain and energy results, the BOM as edited, the SLD and its background, the electrical grouping, the cleaning fleet result, and the record of the inputs the layout was generated from.
Not saved: the Earthing Design inputs, the Robotic Module Cleaning window's answers, anything in Robot count from DXF, the AC-capacity window's ICR block AC (the ICR Block value it wrote is saved), and view state — the Layers toggles, Satellite, Wireframe and Piles: ON/OFF. See Projects.
Values the application derives rather than asks for
| Value | How it is derived |
|---|---|
| Tilt angle, override off | Latitude × 0.76 + 3.1° |
| Row pitch, override off | The no-shading pitch at winter-solstice solar noon |
| GCR | Table height ÷ row pitch on fixed tilt; aperture ÷ effective east–west pitch on a tracker |
| Number of control rooms | For each separate piece of land — tables linked by gaps of no more than 300 m — its MWp ÷ ICR Block, rounded up, half tables weighing 0.5; the plant count is the sum. Re-checked after the tables under the rooms are cleared, and on fixed tilt again after the building-shadow keep-clear, which can only lower it |
| Arrester count | A square grid at the protection radius inside the usable area, plus one extra arrester for any table left beyond the radius of every placed one |
| Street light count | Roughly the perimeter ÷ the pole-to-pole span |
| Pile count | Full units × the full pattern + half units × the half pattern |
| ACCBs per ICR block | The block's inverters ÷ Inverters per ACCB, max, rounded up |
| Transformers per ICR block | The larger of feeders ÷ the per-transformer maximum and, with an inverter file, the block load ÷ the size limit, both rounded up |
| Transformer (IDT) rating | The load (Σ PmaxOut of the inverters on it) rounded up to the next listed rating within the limit |
| Transformer windings | Feeders on the transformer + 1 |
| Power transformer | Σ PmaxOut × margin ÷ derating, rounded up to the next listed MVA rating |
| Cleaning fleet | One robot per line to start, growing where a line is broken by an unbridged gap and where a charge cannot finish a segment |
| Plant AC capacity | The inverter file's AC power rating × the inverter count, or the target of a Simulation with AC Capacity when one was run |
| Temperature loss | The module temperature model, once a module file supplies the power coefficient |
| Shading loss, auto on | Row-to-row shading from the plant's GCR, computed on Generate Layout |
| Specific yield | Annual GTI × performance ratio |
| CUF | Year-one energy ÷ (capacity in kWp × 8760 hours) |
Where to go next
Saving and reopening projects
The .slp project file keeps a working session — every input, the layout, hand edits, diagram and materials list — and reopens ready to export, or says what changed.
Summary view
Every row of the Summary view — how the per-plant sheet is laid out, the banners above it, what each row reports, and when a row reads — or 0.