CAD drawing boundaries
Using a DXF as the plant boundary — which layer names mark water, obstructions and line corridors, and how the Site reference window says where the drawing sits.
A CAD drawing can be used as the boundary input: pick a .dxf file
with Browse… on the Site tab and the application reads the plant
boundary from it — or several boundaries, for a multi-plot site — along with
the water bodies, obstructions and line corridors drawn inside them. Which is
which is decided by the name of the layer each shape sits on, in the same
way a Google Earth file is read by the names of its features.
What a CAD drawing does not reliably carry is a position on the earth. Its coordinates may be UTM metres, or they may be local drawing coordinates with no link to the ground. So every drawing is loaded through the Site reference window, which asks where it sits: at its own UTM coordinates, at a latitude and longitude you type, or nowhere in particular — Layout only. That answer decides whether the design gets an energy estimate, a Google Earth export and automatic tilt and row pitch. The drawing's own coordinates are never changed: the exported drawings come back in them.
What is extracted
The application reads polylines — LWPOLYLINE and POLYLINE entities —
and sorts them by the layer they are drawn on:
- A plant boundary is any closed polyline on a layer whose name matches none of the keep-clear keywords below, and that is not drawn inside another such polyline. Several of them make a multi-plot site, each with its own column in the Summary view — the boundaries may sit on one layer or on several. See Multi-plot sites.
- A keep-clear area is a closed polyline on a layer whose name matches one of the keywords. No module table or tracker is placed on it. Water is drawn in blue and exported on the water layer; everything else is a hard obstruction. Each area belongs to the boundary that contains it.
- A line corridor is an open polyline, or a plain
LINE, on a layer named for a transmission line, road, canal or similar. It is buffered by the Transmission line corridor setback on each side, exactly as a line feature in a Google Earth file is. See Site parameters. - Any other closed polyline inside a boundary — on a layer with no keyword in its name — is a generic obstruction: kept clear, but not identified as water and not given a corridor.
A shape placed as a block (an INSERT) on a keep-clear layer is read too:
a building or a pond drawn as a block is exploded and kept clear. Blocks on
other layers — title blocks, north arrows, legends, key plans — are left alone,
so their line-work is never mistaken for a boundary or an obstruction.
If no closed polyline qualifies as a boundary at all — every ring in the file is on a keep-clear layer — the largest ring is taken as the boundary so a layout can still run.
Layer names
Classification is by layer name keyword, and the match is case-insensitive: the keyword can sit anywhere in the layer name, with anything around it. Water keywords are checked first, then line keywords, then obstruction keywords.
| Class | Layer-name keywords |
|---|---|
| Water body | pond, water, lake, reservoir, lagoon, tank |
| Line corridor | tl, transmission, power line, powerline, ht line, ht_line, road, canal, river, highway, railway, nala, drain |
| Obstruction | obstruction, obstacle, keep out, keepout, keep-out, exclusion, building, sand dune, sand, dune, structure, tower, forest, graveyard, temple |
tl has to stand on its own — TL, TL_ROUTE and tl-33kv match, while
settlement and control_panel do not.
| Layer name | Read as |
|---|---|
PLANT_BOUNDARY, 0, SITE | Boundary (closed) or ignored (open) |
POND, Water_Body, OHT tank | Water body |
TL, Transmission Line, ROAD, Canal-2 | Corridor if open, obstruction if closed |
BUILDING, Sand Dune, obstruction-1 | Obstruction |
settlement, Excl-04, Feature 12 | No keyword — a closed shape inside a boundary is a generic obstruction |
It is the layer name that is read, not the entity's own name, text label or
colour. A pond drawn on layer 0 with a text label reading "Pond" is a generic
obstruction: kept clear, but not water. Put each kind of feature on a layer
named for it before exporting.
A circle, a spline, an arc or a hatch is not read at all — neither as the
boundary nor as a keep-clear area, whatever layer it is on. A site outline drawn
as a spline is not found, and the application asks you to draw the boundary as
a closed LWPOLYLINE or POLYLINE. A pond drawn as a circle is not kept
clear, and nothing warns you: the layout covers it. A plain LINE is
read only on a line-corridor layer.
Convert everything you need read into a polyline before exporting, and check closure while you are there. Anything else in the drawing is ignored rather than misread, so dimensions, text, title blocks and hatching do no harm and a busy drawing does not need cleaning up first.
Save the drawing as .dxf from your CAD program. The file picker also lists
.dwg, but a .dwg opens only if the free ODA File Converter is already
installed on the machine — the application does not include it — and that
route is not one the documentation covers.
The Site reference window
Choosing a .dxf opens the Site reference window before the file is
taken. It asks one question — where the drawing sits — and nothing in it is
pre-filled. Cancel closes it without loading the file; whatever file was
loaded before stays loaded.
A navy strip at the top names the file and describes what the application found in it:
| Drawing | The strip's second line, for example |
|---|---|
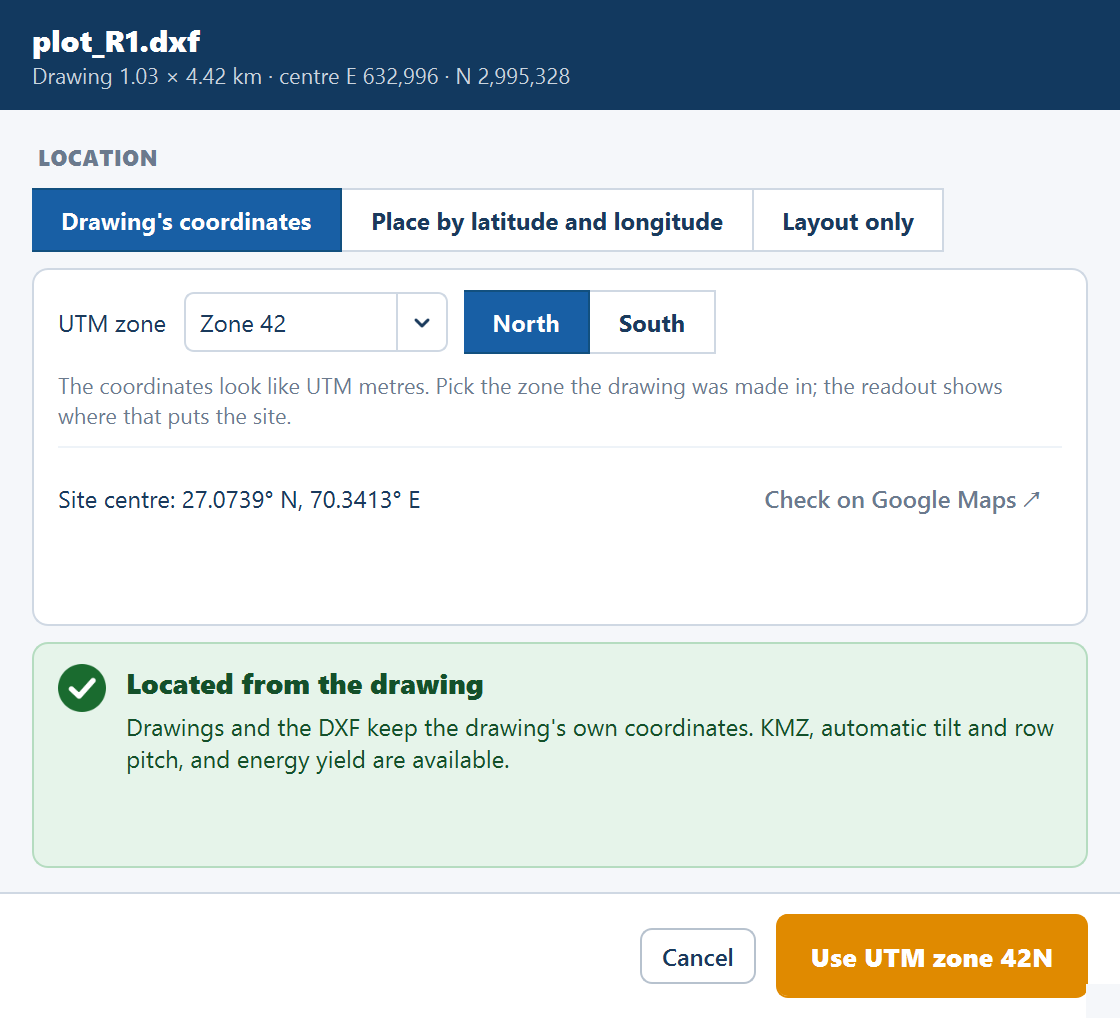
| Coordinates that look like UTM metres | "Drawing 1.03 × 4.42 km · centre E 632,996 · N 2,995,328" |
| Local drawing coordinates | "Drawing 0.60 × 0.50 km · centre x 300 · y 250 (local)" |
| Coordinates that cannot be read | "Couldn't read the drawing's coordinates. Place it by latitude and longitude." |
Under it, the LOCATION card offers up to three answers as a segmented control. The first one offered is selected when the window opens.
| Mode | Offered | What it means |
|---|---|---|
| Drawing's coordinates | Only when every coordinate of the boundary looks like UTM metres — eastings between 100 000 and 900 000 m, northings between 0 and 10 000 000 m. Such a drawing opens in this mode | The drawing's numbers are UTM metres; you say which zone |
| Place by latitude and longitude | Always; it is the first mode for a drawing in local coordinates | You say where the centre of the site is |
| Layout only | Always | The site's location stays unknown |
A banner under the card states what the choice gives. The footer holds Cancel and the primary button, whose label follows the mode, and gives the reason when the primary button is not yet available.
Drawing's coordinates
When the drawing declares its coordinate system — a WGS 84 / UTM zone stored in the file — the card shows it, for example "WGS 84 / UTM zone 42N · EPSG:32642", with the note "Declared in the drawing (GEODATA). The coordinates are used as they are." The primary button reads Use the drawing's coordinates.
When it does not, pick the zone yourself: a UTM zone list (Pick a zone, Zone 1 to Zone 60) and a North / South switch. No zone is ever pre-selected; once you have picked one, a Last used button (for example Last used: 42N) offers it again, in this and later sessions. The note reads "The coordinates look like UTM metres. Pick the zone the drawing was made in; the readout shows where that puts the site." Until a zone is picked the readout reads "Pick a zone to see where the site lands." and the primary button, Use UTM zone …, waits with the reason "Pick the zone the drawing uses."
Once the zone is known the readout gives the site centre — "Site centre: 27.0710° N, 70.3387° E" — with a Check on Google Maps ↗ link to confirm it lands where the site is. The banner reads Located from the drawing: "Drawings and the DXF keep the drawing's own coordinates. KMZ, automatic tilt and row pitch, and energy yield are available." The primary button names the zone, for example Use UTM zone 42N.
Two checks guard the zone. A site put beyond 60° latitude gets a warning — "Check the hemisphere. A plant this far north is unlikely." — but can still be used. A site outside the range UTM covers, 80° S to 84° N, cannot: the reason reads "Pick a zone that puts the site on the map."
Place by latitude and longitude
| Field | Default | Range | What it does |
|---|---|---|---|
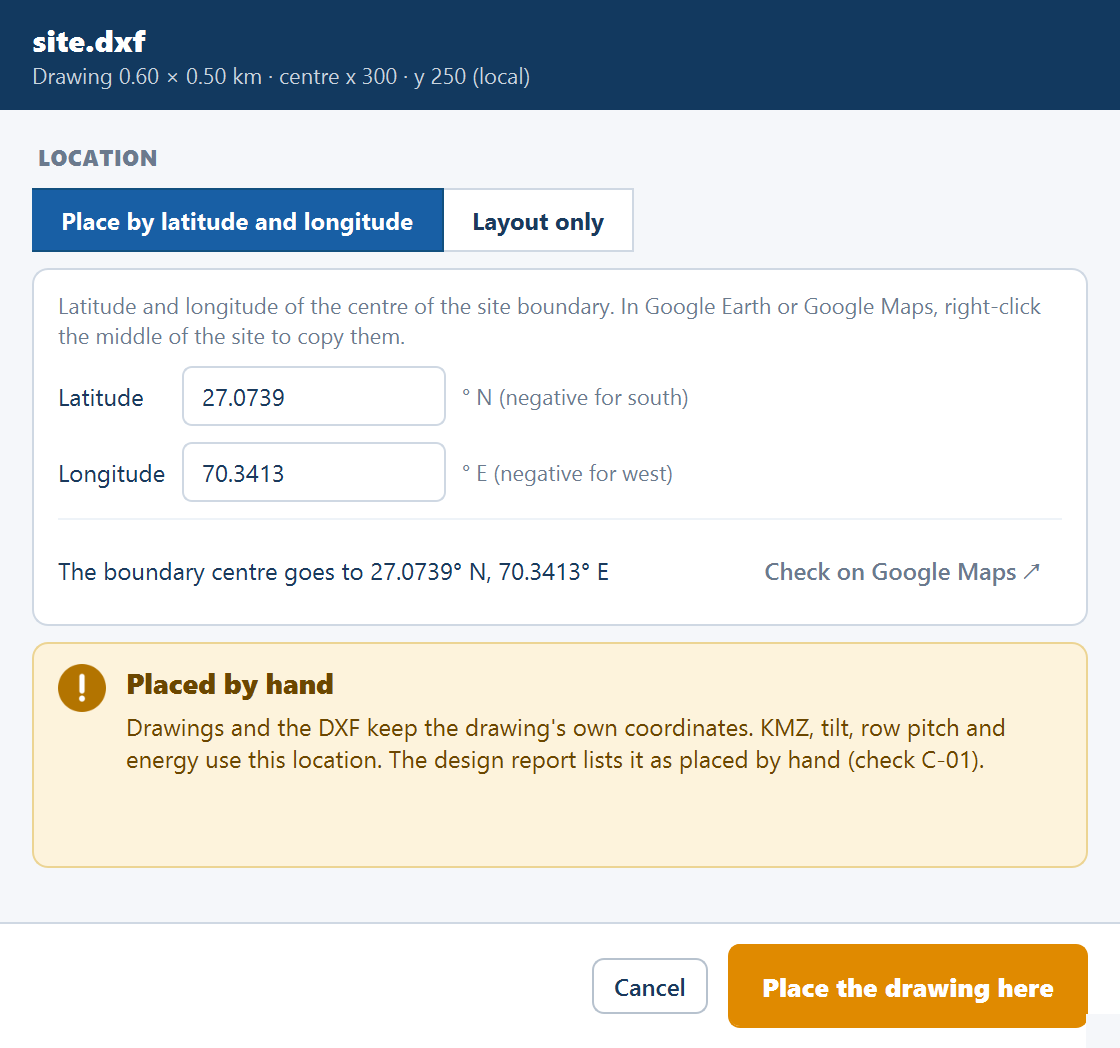
| Latitude | empty (placeholder e.g. 27.0739) | −90 to 90 | The latitude of the centre of the site boundary, in decimal degrees — "° N (negative for south)" |
| Longitude | empty (placeholder e.g. 70.3413) | −180 to 180 | The longitude of the same point — "° E (negative for west)" |
The note reads "Latitude and longitude of the centre of the site boundary. In Google Earth or Google Maps, right-click the middle of the site to copy them." A minus sign typed as "−" is accepted. The readout says "Both values are needed." until both are valid, then "The boundary centre goes to 27.0739° N, 70.3413° E", with Check on Google Maps ↗ to open Google Maps at that point. A value out of range outlines its field, and the reason reads "Fix the highlighted value."
The primary button is Place the drawing here. The banner reads Placed by hand: "Drawings and the DXF keep the drawing's own coordinates. KMZ, tilt, row pitch and energy use this location."
Layout only
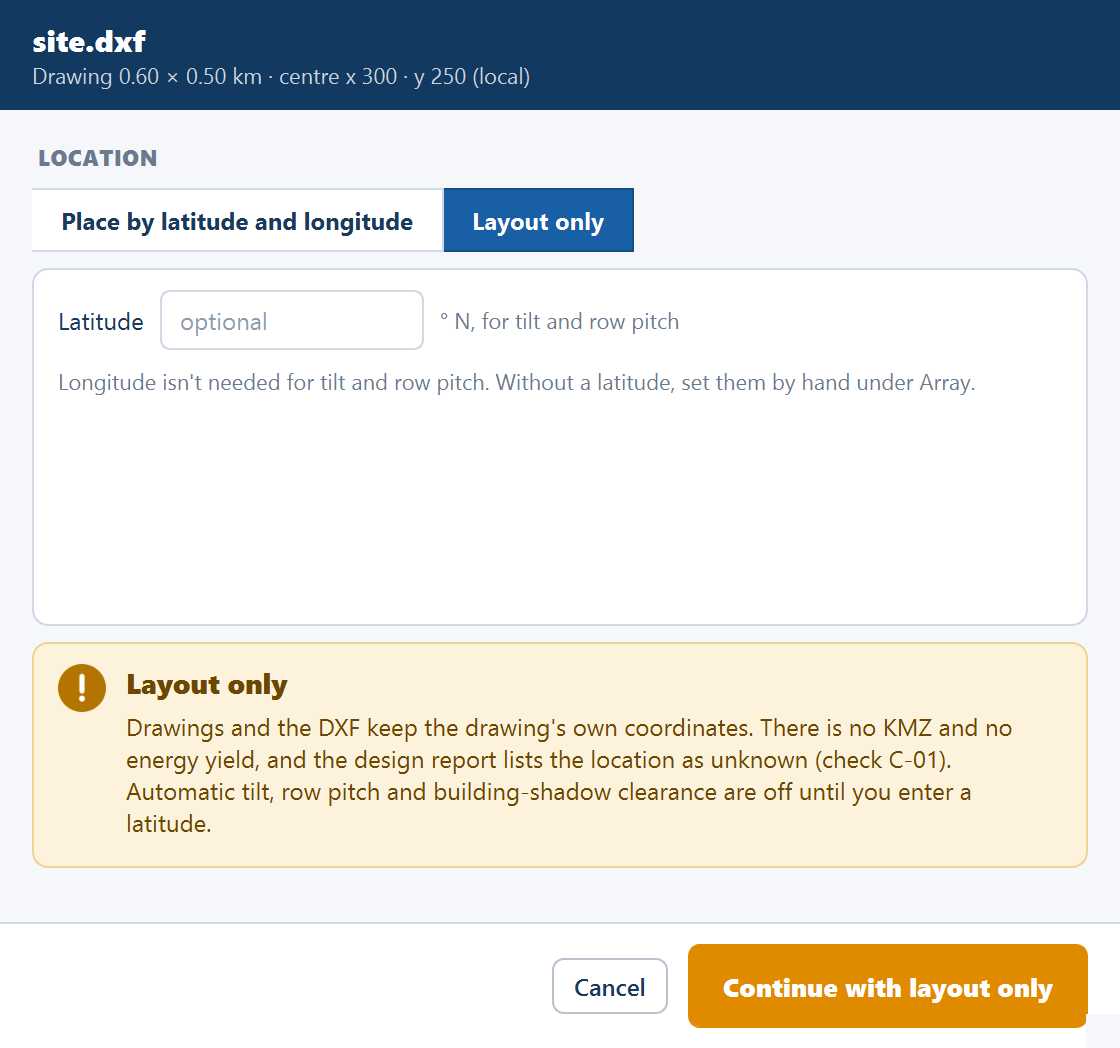
Layout only loads the drawing without saying where on the earth it is. The card holds one optional field, Latitude — "° N, for tilt and row pitch" — and the note "Longitude isn't needed for tilt and row pitch. Without a latitude, set them by hand under Array." The primary button is Continue with layout only; it waits only when the latitude you typed is out of range.
The banner spells out the cost: no Google Earth export and no energy yield, and — until you give a latitude — no automatic tilt, row pitch or building-shadow clearance. With a latitude it ends "Tilt and row pitch use 27.0739° N."
What each choice gives
| Drawing's coordinates | Placed by latitude and longitude | Layout only | |
|---|---|---|---|
| Where the site is | At the drawing's own numbers, read as UTM metres in the zone chosen | The centre of all the boundaries together is put at the typed point; the drawing is moved, never scaled or rotated | Unknown |
| Automatic tilt and row pitch | From the site | From the typed latitude | From the typed latitude, if you gave one |
| Building-shadow clearance | On | On | Skipped without a latitude |
| Automatic shading value (Yield tab) | Computed | Computed | Without a latitude it reads "Auto → — (needs the site's latitude)" |
| Energy yield | Yes | Yes | Off — Calculate Energy is disabled, and its tooltip, the Yield tab's status line and the Energy view read "Energy yield is off: the site's location is unknown (layout only)." |
| Google Earth export | Yes | Yes | Disabled; the menu item reads Export KMZ — location unknown |
| Satellite image | Yes | Yes | Refused — "Satellite imagery needs the site's location." |
| Shadow View | Yes | Yes | Without a latitude, refused — "Shadow view needs the site's latitude: pick the boundary file again and enter one." |
| Units note, axis ticks, cursor position, pile labels | UTM, e.g. "UTM 42N · metres" | The drawing's own coordinates — "Drawing coordinates · metres" | The drawing's own coordinates |
| The CAD drawing and the ICR-block drawing set | UTM — the same coordinates as the input | The drawing's own coordinates, so the export lies exactly over the source drawing | The drawing's own coordinates |
| Pile coordinates workbook | Easting (m) and Northing (m), with longitude and latitude | X drawing (m) and Y drawing (m), with longitude and latitude | X drawing (m) and Y drawing (m); longitude and latitude blank |
With Layout only and no latitude, the automatic tilt and row pitch have nothing to work from. Give a latitude in the window, or tick both overrides under Spacing and tilt and set the tilt angle and row pitch by hand before generating.
Placing a drawing distorts nothing. Its shape and area are kept exactly: a 400 m edge in the drawing is 400 m on the ground, and an outline enclosing 120 acres still encloses 120 acres. The point you type is the centre of the site — the centre of all the boundaries together — not a corner. A corner coordinate shifts the whole plant by half its own width, which matters for the aerial imagery, the Google Earth export and anything you compare against the real site.
Changing the location later
The choice is saved in the project and reused at every Generate Layout without asking again. The window opens only from Browse…, and picking the file again replaces the layout with a preview of the boundary, so changing the location means picking the file again, answering the window, and generating again. When that Generate finds the boundary has moved, it carries your obstructions, main control room, unit substations, objects and sketch annotations to the new position, and the status line says so — for example "Kept your obstructions, MCR, …, moved to the drawing's new location."
A project that holds a CAD or image boundary but no saved answer opens the window at its first Generate. Cancel there leaves the layout ungenerated: "Layout not generated: say where the drawing sits first."
Loading a drawing
Pick the file with Browse…
On the Site tab, click Browse… on the Input Boundary File card and
choose the .dxf. The Site reference window opens straight afterwards.
Say where the drawing is
For a drawing made in UTM, check the zone the window shows, or pick it, and click Use UTM zone … (or Use the drawing's coordinates). For a drawing in local coordinates, type the latitude and longitude of the centre of the site and click Place the drawing here. Use Layout only for a quick geometric check, and give it a latitude if you want the automatic tilt and pitch.
Generate, then check the reported area
Read the Site area chip under the plot, or the Plant area (acres) row of the Summary view, and compare it against the survey. It is the gross boundary area before the perimeter road is taken off, so it should match the survey directly. If it does not, check the drawing before going further.
Add anything the drawing did not carry
A feature drawn as a circle or a spline, or on a layer with no keyword in its name, was not kept clear or was kept clear as a plain obstruction. Either fix the layer name in the CAD program and load the file again, or add the exclusion by hand from the Tools tab. See Obstructions and exclusions.
Contour files are a separate input
A DXF can also be supplied as contour data in Topography, which is an entirely different input from the boundary. With a CAD boundary, a contour drawing must be drawn in the same coordinates as the boundary drawing. On a site loaded as layout only, only a contour DXF is accepted: a CSV of longitude, latitude and elevation is refused, and no satellite elevation data is fetched. Do not use the same file for both purposes unless it genuinely is both.
Where to go next
Which boundary file to use
The three input types compared
Boundary file requirements
The feature-name keywords — a CAD drawing's layer names follow the same idea
Spacing and tilt
Setting tilt and row pitch by hand when there is no latitude
The CAD drawing export
The layered drawing, in the same coordinates as your input
Boundary file requirements
How to draw and name the features in a Google Earth file so the application reads the boundary, water bodies, obstructions and transmission lines correctly.
Image boundaries
Tracing a plant boundary from a scan, a screenshot or an exported picture, and setting the scale in the Site reference window that turns pixels into metres.