Reading results
The summary report
The plain-text project report on the Summary tab, its fixed section order, and its six export buttons.
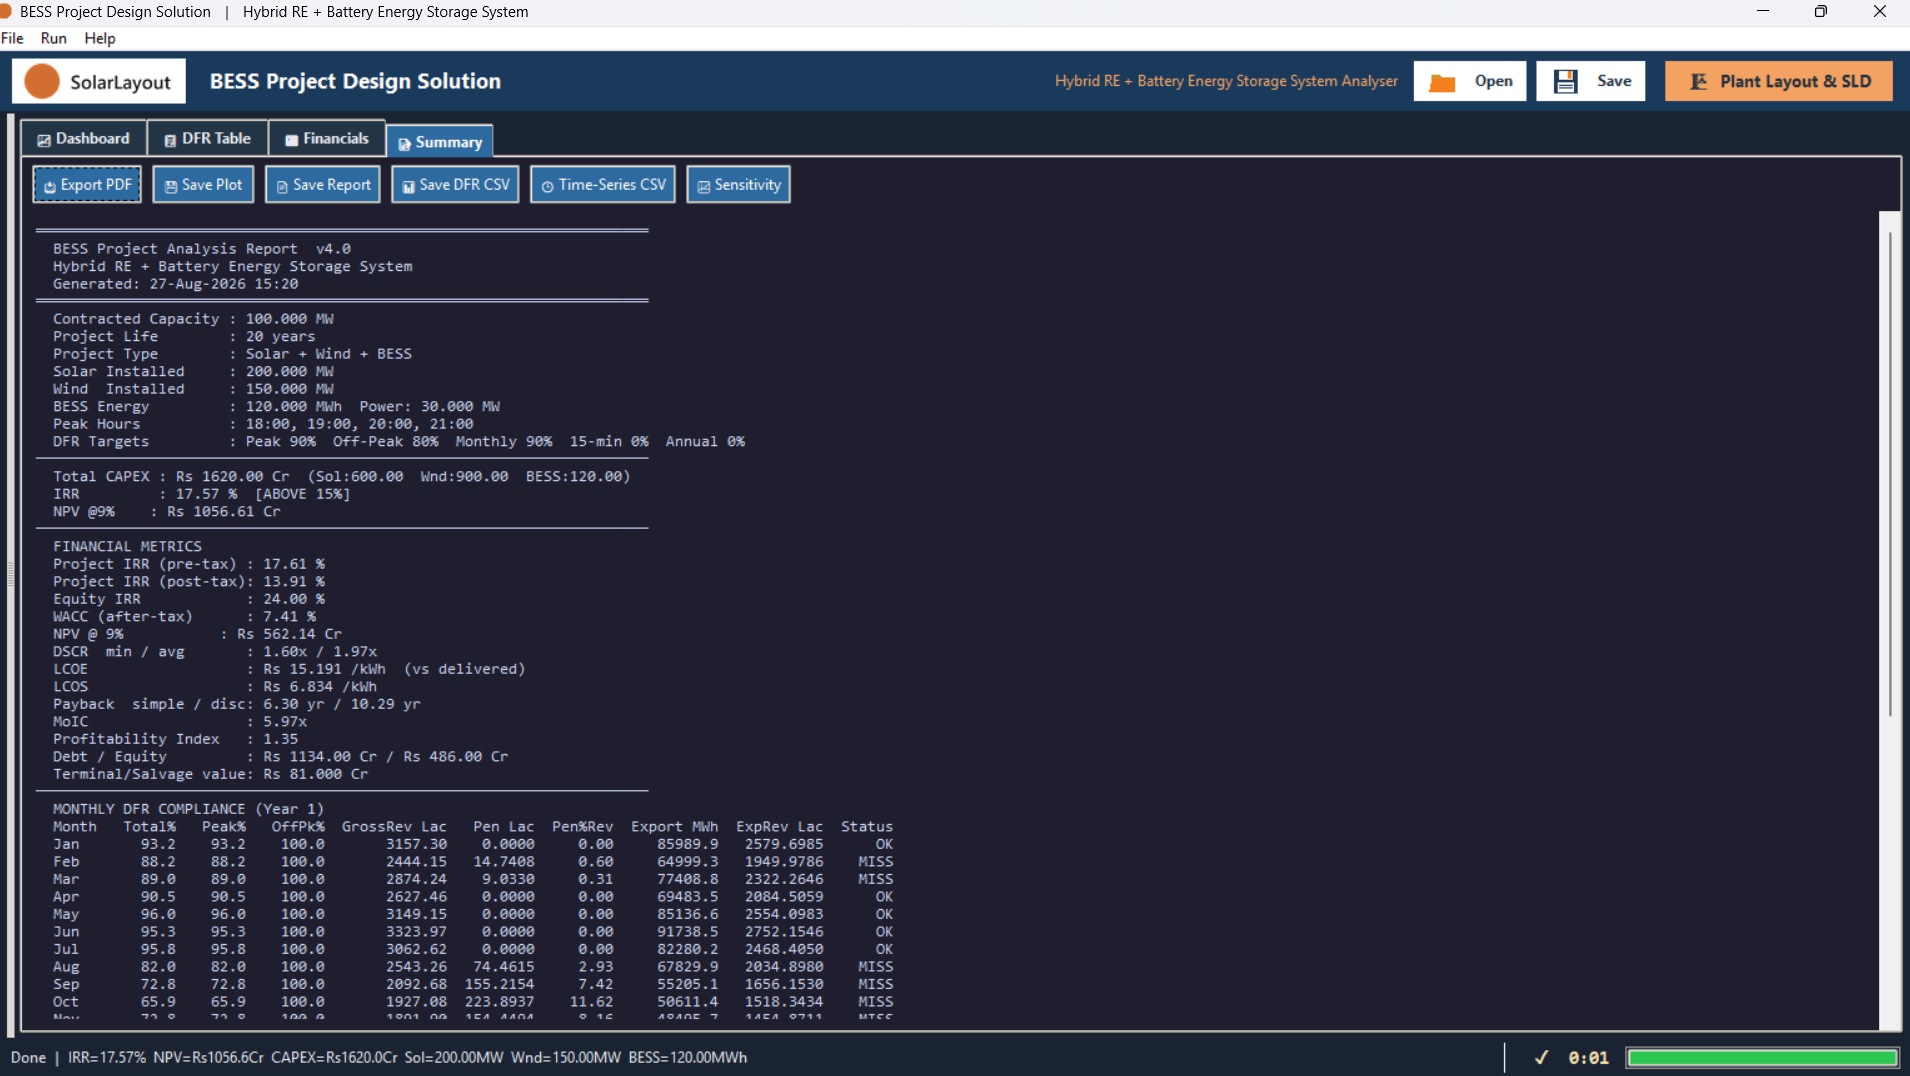
The 📝 Summary tab holds a plain-text project report in a dark, console-style panel, filled in once a run finishes, together with the toolbar of export buttons used to save it in other forms.
What the report contains
The report runs in a fixed order:
- A project header and configuration block.
- A CAPEX, IRR and NPV headline.
- A FINANCIAL METRICS block, including an [ABOVE 15%] or [BELOW 15%] tag on the headline IRR line — compared against the same fixed 15% benchmark as the IRR badge on the dashboard, not the Project Target IRR field.
- A MONTHLY DFR COMPLIANCE (Year 1) table.
- A YEAR-BY-YEAR CASHFLOW table.
Export toolbar
Six buttons run along the top of the tab, in this order:
- 📥 Export PDF
- 💾 Save Plot
- 📄 Save Report
- 📊 Save DFR CSV
- 🕒 Time-Series CSV
- 📈 Sensitivity
The first five are licence-gated exports — the same requirement as ▶ Simulate and ⚙ Optimise (see How access works). 📈 Sensitivity is not gated.