The financials table
The Financials tab's headline metrics and per-year cash-flow column groups, and its row and text shading.
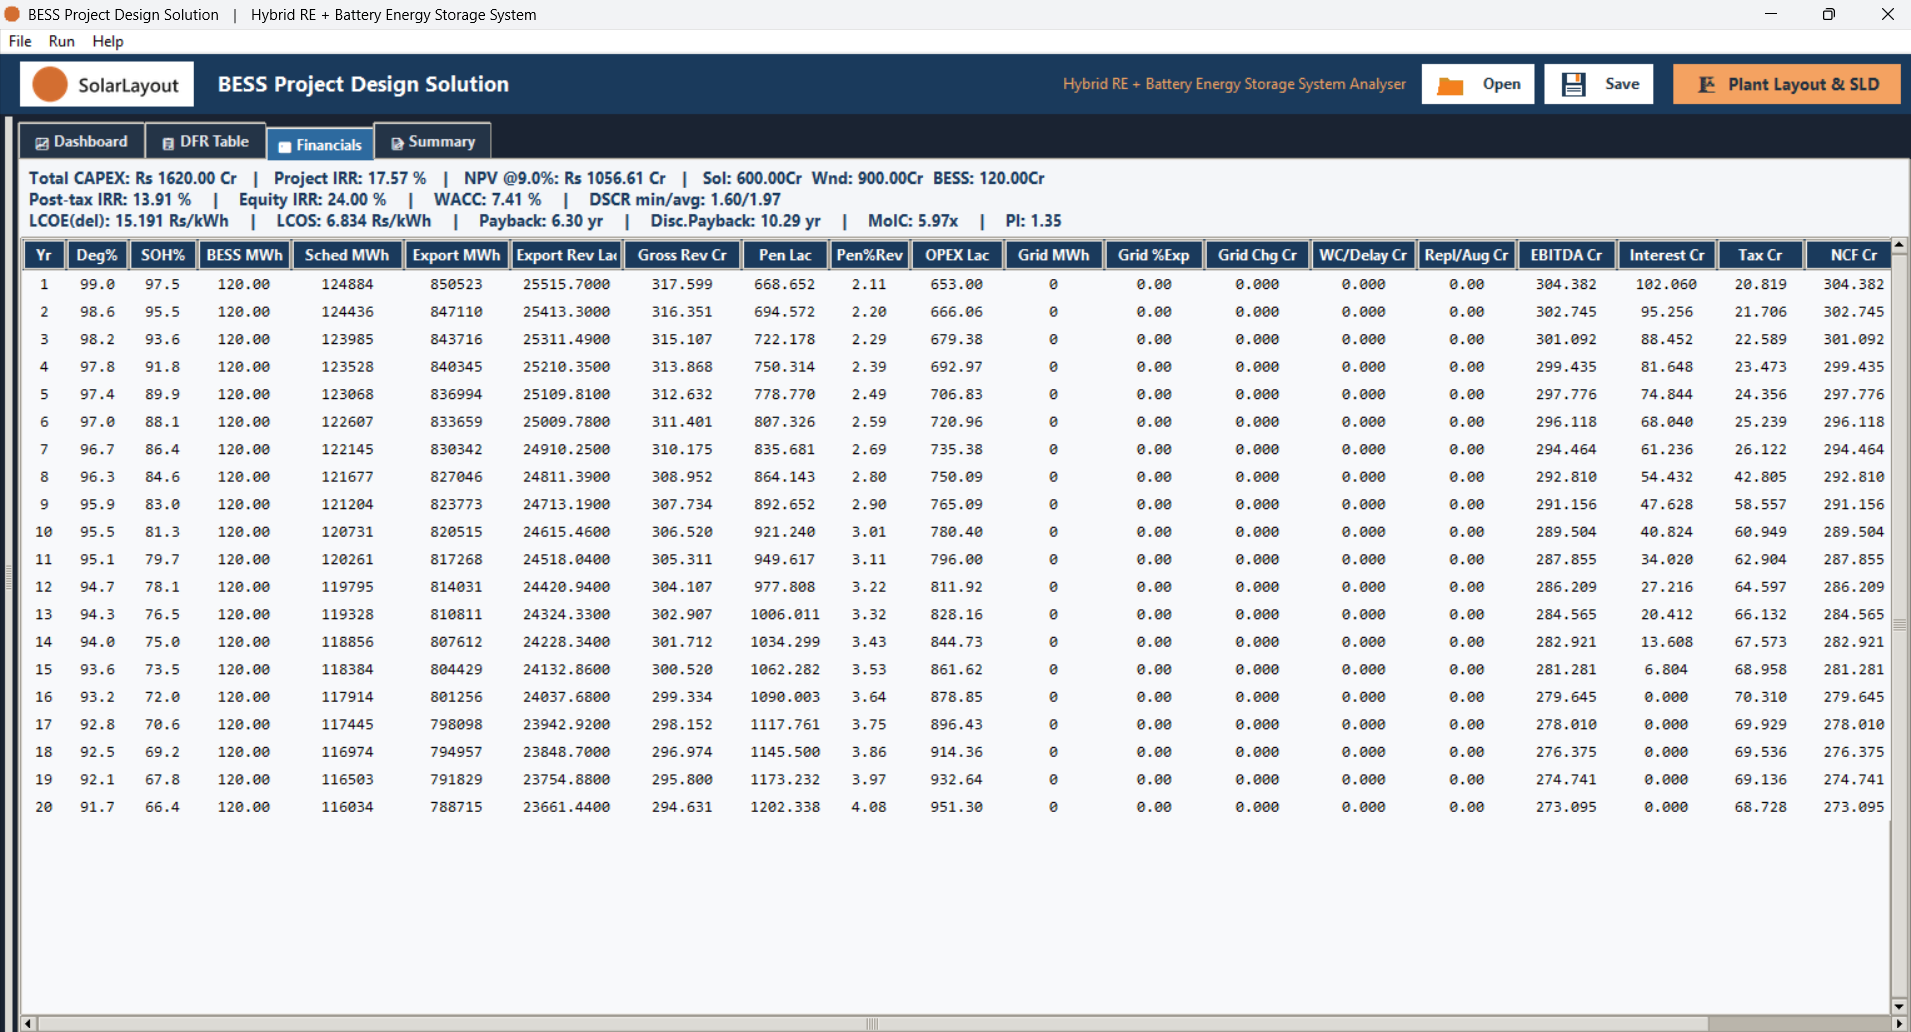
The 💹 Financials tab shows the same run's economics as a table: a short block of headline metrics at the top, and a per-year cash-flow table beneath it, one row per project year.
Headline metrics
The headline block is a small number of summary lines, each shown only when the model has a value to report for it:
- Total CAPEX, Project IRR, NPV at the discount rate set on the 🏦 Finance tab, and the CAPEX split across Solar, Wind and BESS.
- Post-tax IRR, Equity IRR, WACC (weighted average cost of capital), and DSCR (debt-service coverage ratio) minimum and average across the project.
- LCOE (levelised cost of energy, on the basis chosen on the Finance tab), LCOS (levelised cost of storage), Payback, Discounted Payback, MoIC (multiple on invested capital) and PI (profitability index).
- Grid-charging totals — shown only when any project year drew grid energy: Year 1 grid energy and its share of export and its cost, and the same totals over the plant's life.
- Payment-delay working-capital cost — shown only when Receivable Lag is set above zero: the total cost, and its impact on IRR and NPV.
Any individual negative figure within these lines is painted red inline. What each of these metrics is and how it's calculated is covered separately from this page, which only says what's shown and where.
Per-year cash-flow column groups
The table beneath the headline runs one row per project year. Its columns fall into these groups, left to right:
| Group | Columns | What it reports |
|---|---|---|
| Year & battery health | Yr, Deg%, SOH% | The project year, and that year's degradation and state of health |
| Energy | BESS MWh, Sched MWh, Export MWh | Energy the battery handled, scheduled and exported that year |
| Revenue | Export Rev Lac, Gross Rev Cr | Export revenue and gross revenue for the year |
| Penalty | Pen Lac, Pen%Rev | That year's DFR shortfall penalty, and its share of revenue |
| Operating cost | OPEX Lac | That year's operating cost |
| Grid charging | Grid MWh, Grid %Exp, Grid Chg Cr | Grid energy used to charge the battery, its share of export, and its cost |
| Working capital & replacement | WC/Delay Cr, Repl/Aug Cr | Payment-delay working-capital cost, and battery replacement/augmentation cost |
| Cash flow & financing | EBITDA Cr, Interest Cr, Tax Cr, NCF Cr, Equity CF Cr, DSCR | EBITDA, interest, tax, net cash flow, equity cash flow and DSCR for the year |
That's twenty-two columns in total, in a fixed order. The exhaustive per-year column reference — the exact header for each one — lives in the reference section of this documentation rather than being repeated here.
Row and text shading
A year's row is shaded light red when that year's net cash flow (NCF) is negative, and yellow when it's a replacement or augmentation year — the two are mutually exclusive, and a negative-NCF year takes the red shading even if it's also a replacement/augmentation year.
Independently of the row's background, a row's own figures are painted red wherever any of Gross Revenue, EBITDA, NCF, Equity Cash Flow, Interest, Tax, Penalty, OPEX, Export Revenue or DSCR comes out negative for that year — so a row can carry both the background shading and red-painted figures at once.
Hovering over any column heading shows a short tooltip explaining what it reports.
Where to go next
Financing and discounting
Discount rate, LCOE basis, debt, tax and the rest of the model
OPEX, revenue and penalties
The PPA tariff, penalty multiplier and Project Target IRR behind these figures
The summary report
The same headline figures, in a plain-text report you can export
The DFR table
The monthly delivery result behind the penalty columns