Sensitivity analysis
Five ways to test how a Simulate or Optimise result responds to a changed input, from a single sweep to Monte Carlo.
Sensitivity Analysis…, on the Run menu, tests how a completed result moves when one or more inputs change, without you having to re-enter and re-run each variation by hand. It offers five separate methods, each on its own tab of the same window.
What it needs
Sensitivity analysis needs a base case first: a completed Simulate or Optimise result. Without one, the window doesn't open — it warns "Please run Simulate or Optimise first to establish a base case." instead.
The window is also reachable from the 📈 Sensitivity button on the 📝 Summary tab's export toolbar, alongside Run ▸ Sensitivity Analysis….
Unlike ▶ Simulate and ⚙ Optimise, opening the window and running any of its five methods doesn't need this device activated. Only the Single Variable Sweep tab's CSV export does, the same as every other export — see How access works.
The shared driver list
All five methods draw from the same list of drivers: every input that moves NPV or IRR, filtered down to the current project type and to the drivers whose base value isn't zero. That list spans the source capacities, the PPA and export tariffs, each CAPEX and O&M line, the penalty multiplier, plant availability, the discount rate, the debt interest rate (only once debt financing is turned on, see Financing and discounting), module and BESS degradation, and payment lag.
The Single Variable Sweep tab
Sweeps one driver across a range and reports the result at each step.
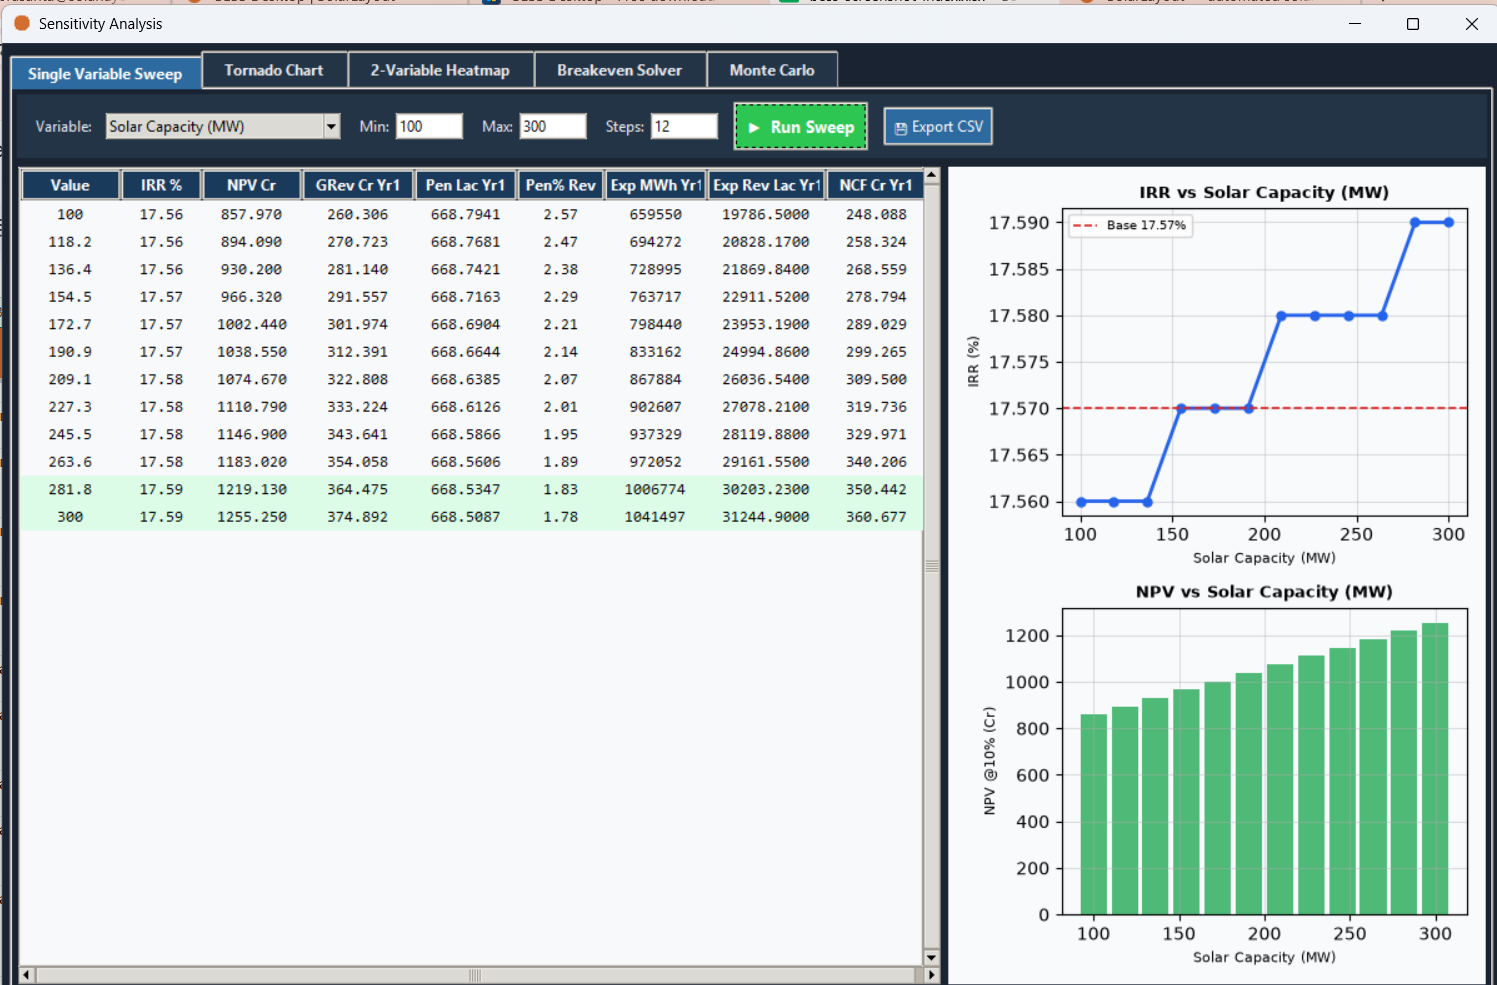
- Inputs: Variable, Min, Max, Steps.
- Buttons: ▶ Run Sweep; 💾 Export CSV, which needs this device activated.
- Output: a table — Value, IRR %, NPV Cr, GRev Cr Yr1, Pen Lac Yr1, Pen% Rev, Exp MWh Yr1, Exp Rev Lac Yr1, NCF Cr Yr1 — with the base row and the best-IRR row highlighted, plus an IRR-vs-variable and an NPV-vs-variable plot.
The Tornado Chart tab
Varies every driver in the shared list one at a time, by the same percentage either side of its base value, and ranks the swings.
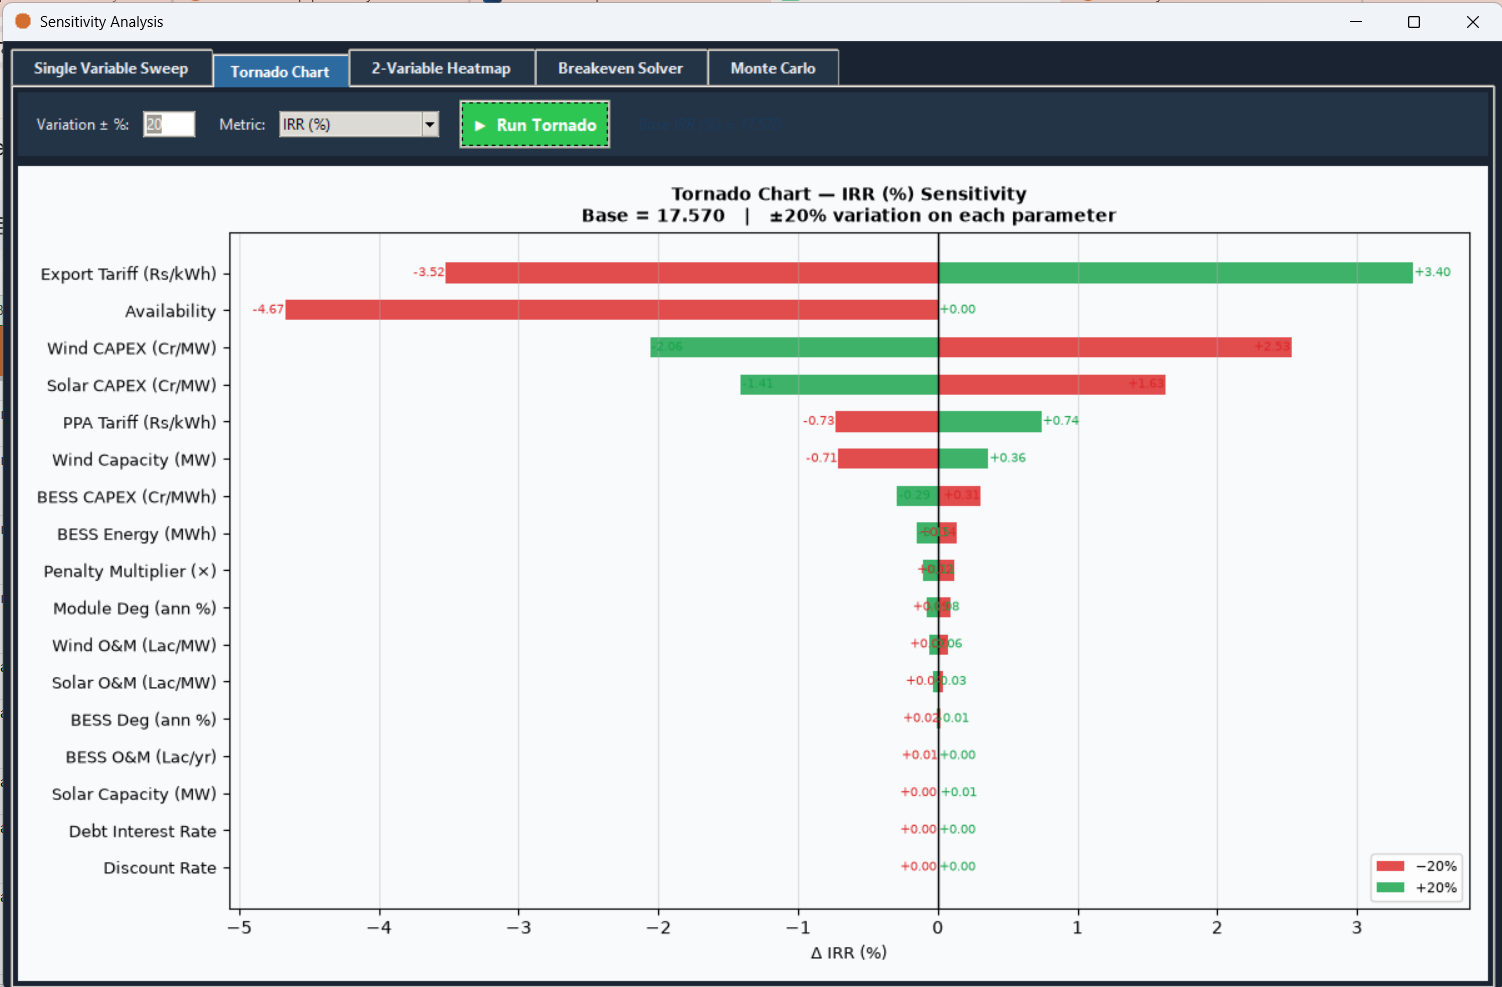
- Inputs: Variation ± % (default 20); Metric — IRR (%), NPV (Cr), NCF Yr1 (Cr) or Penalty Yr1 (Lac).
- Buttons: ▶ Run Tornado.
- Output: a horizontal bar chart of the chosen metric's change per driver, sorted by the size of the swing.
The 2-Variable Heatmap tab
Evaluates the financial model across a grid of two drivers at once, rather than one.
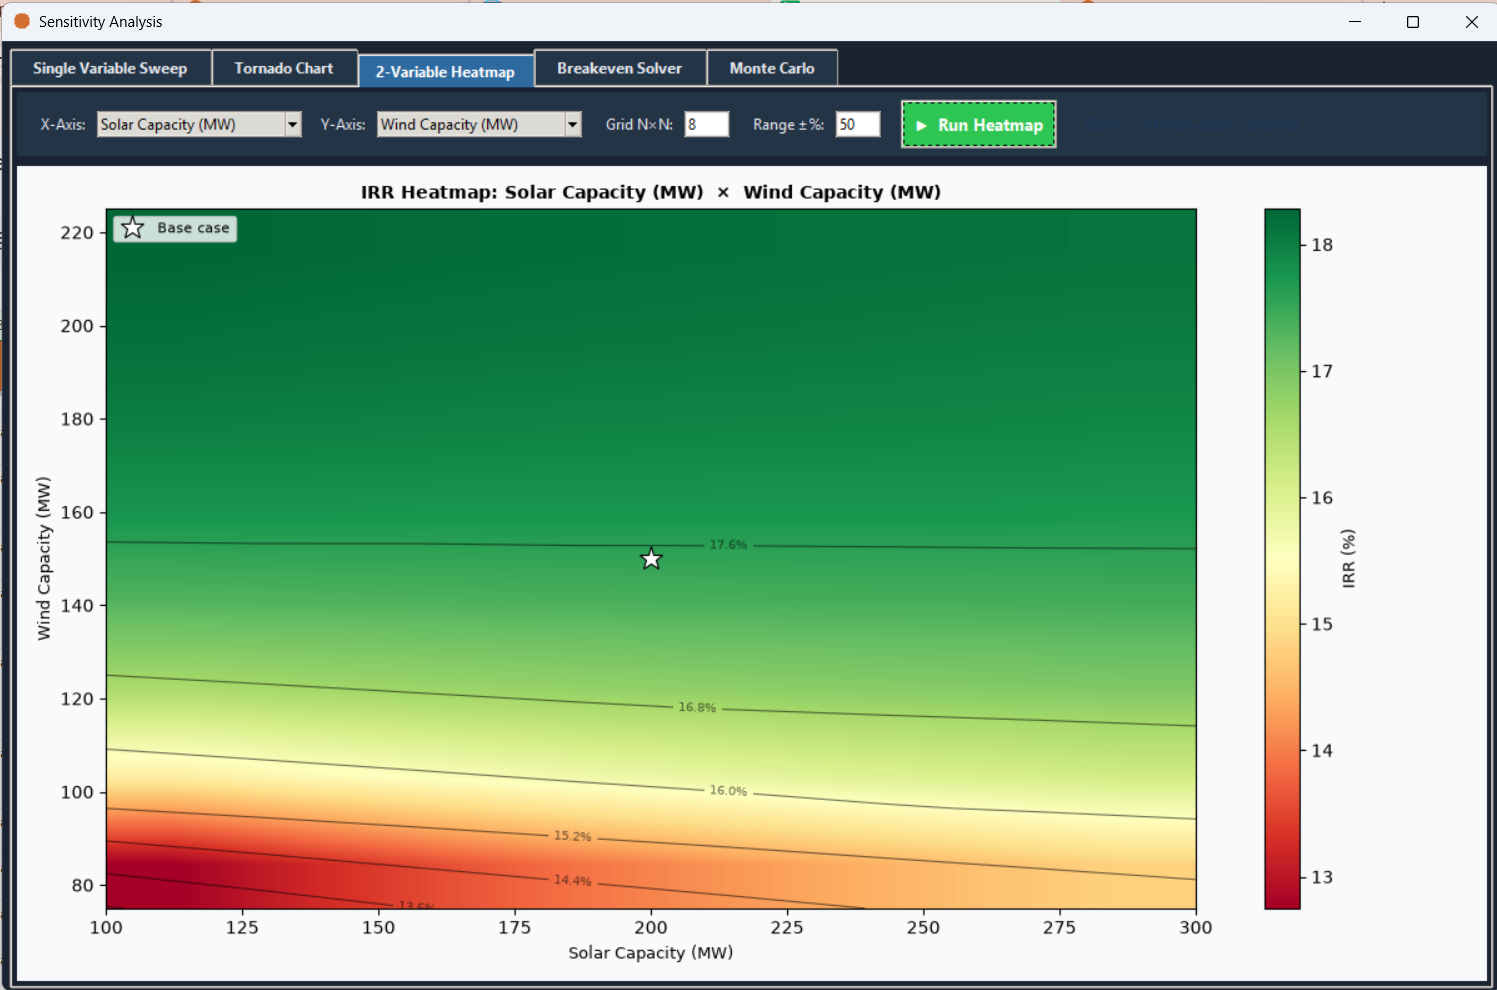
- Inputs: X-Axis driver, Y-Axis driver; Grid N×N (default 8); Range ±% (default 50).
- Buttons: ▶ Run Heatmap.
- Output: an N×N grid of results rendered as an IRR colour map, with contour lines and a marker at the base case.
The Breakeven Solver tab
Solves for the value one driver needs, to hit a target on a chosen metric.
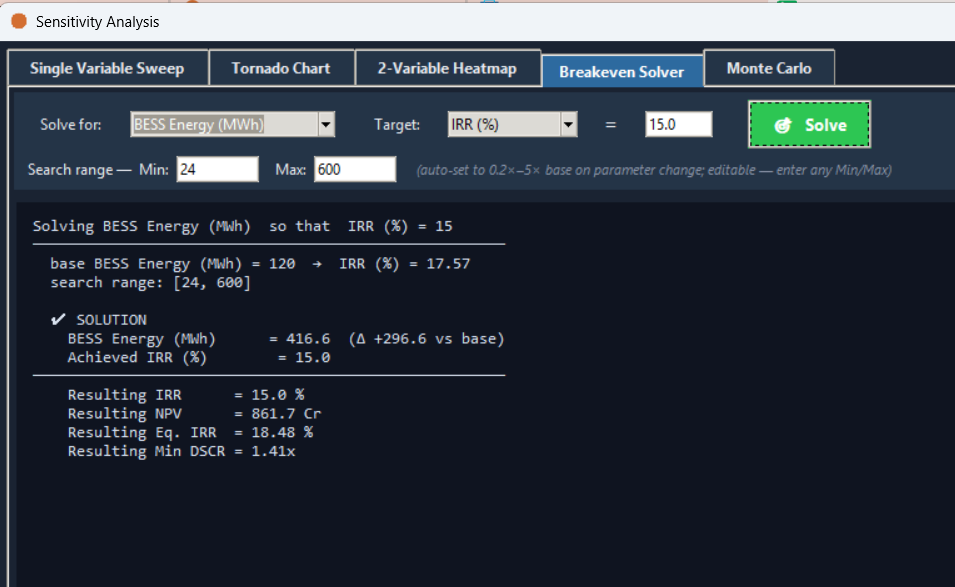
- Inputs: Solve for (the lever, drawn from the same driver list); Target metric — IRR (%), NPV (Cr), Equity IRR (%) or Min DSCR (x) — and its target value; a search range Min/Max, auto-filled to 0.2×–5× the lever's base value and editable.
- Buttons: 🎯 Solve.
- Output: the solved value for the lever, plus the resulting IRR, NPV, Equity IRR and Min DSCR — or, if the target can't be reached within the search range, a message saying so.
Monte Carlo
Draws random variations across every driver at once and reports the spread of outcomes.
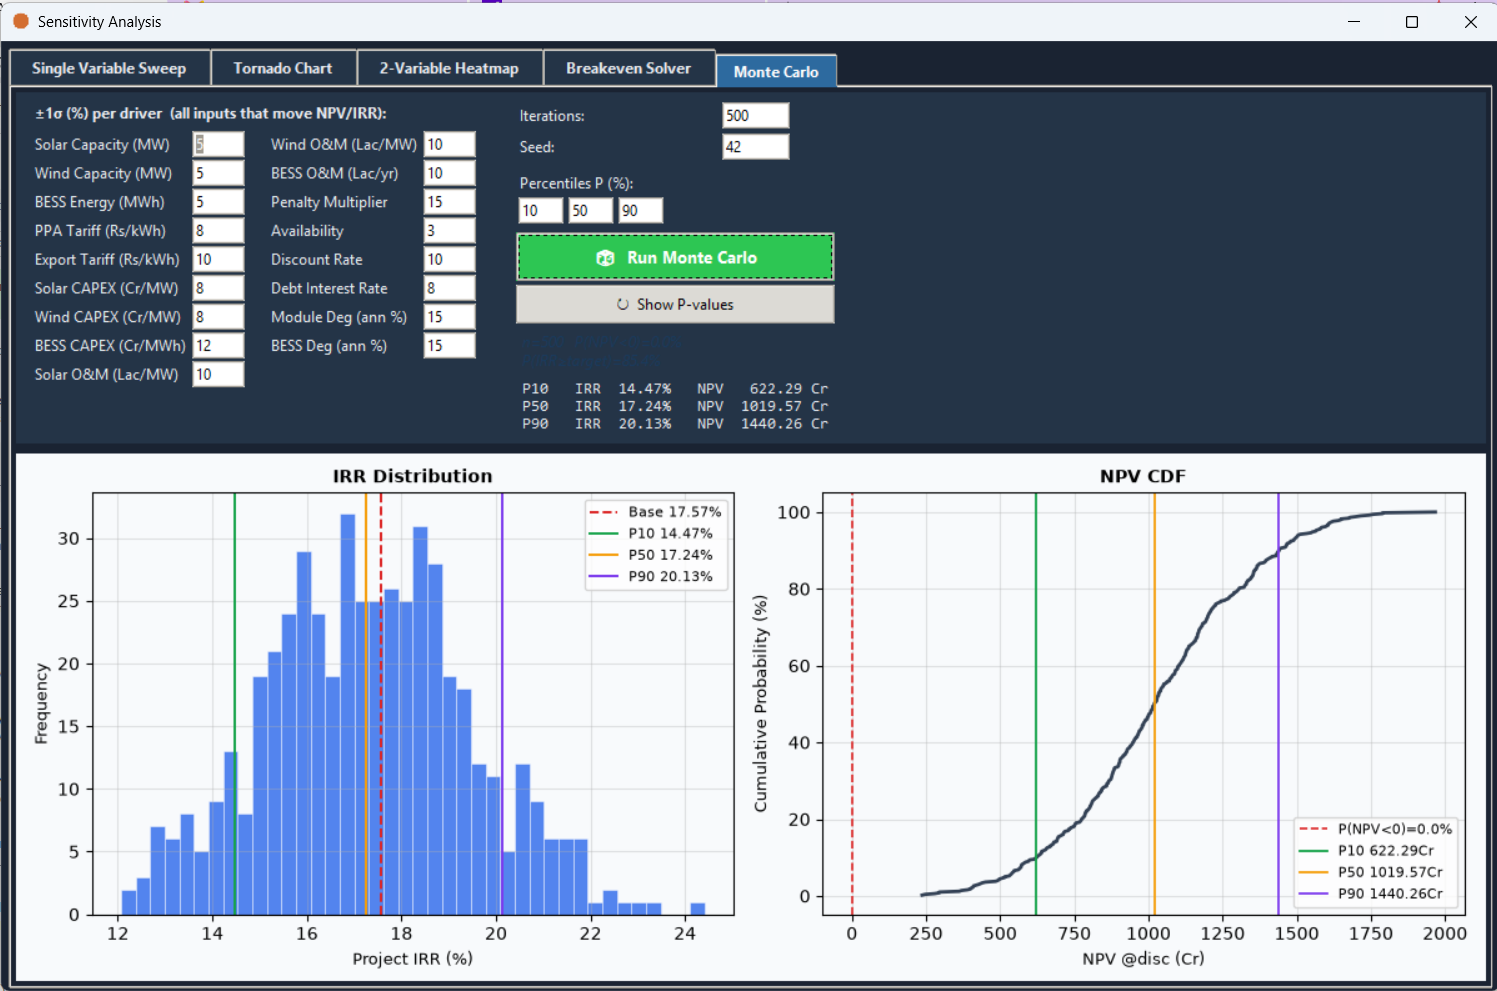
- Inputs: a ± 1σ % for each driver, pre-filled with a sensible default per driver; Iterations (default 500); Seed (default 42); Percentiles P (default 10/50/90, each editable between 0 and 100).
- Buttons: 🎲 Run Monte Carlo; ↻ Show P-values, which re-reports the chosen percentiles from the same sample set without running the simulation again.
- Output: an IRR distribution histogram and an NPV CDF plot, both marked at the base case and at P10/P50/P90, plus the sample count and the probability of a negative NPV and of meeting the target IRR.
Where to go next
Simulate
Run the single case a sensitivity analysis needs as its base
Optimise
Search for a Solar, Wind and BESS mix instead of testing one
OPEX, revenue and penalties
The PPA tariff and penalty multiplier among the shared drivers
Financing and discounting
The discount rate and debt interest rate among the shared drivers