Delivery Fulfilment Ratio (DFR)
What DFR measures at each granularity, how its five targets are set, and how a shortfall becomes a financial penalty.
DFR — Delivery Fulfilment Ratio — is the share of required or contracted energy the plant actually delivered in a given window: delivered energy divided by required energy. It's the figure the application uses to judge whether a run met its obligation, at every timescale from a single 15-minute step up to the whole year.
The five granularities
DFR is tracked at five separate levels, each compared against its own target:
| Granularity | What it compares |
|---|---|
| 15-minute | Delivered vs required energy at each individual simulation step |
| Peak-hour | Delivered vs required energy, summed across a day's Peak hours |
| Off-Peak | Delivered vs required energy, summed across a day's Off-Peak hours |
| Overall monthly | Delivered vs required energy, summed across the whole calendar month |
| Annual | Delivered vs required energy, summed across the whole year |
Falling short of the Peak-hour, Off-Peak, Overall monthly or 15-minute target is what triggers a penalty — see below. The Annual target is tracked and compared the same way, but on its own it doesn't feed into the penalty formula.
For a Standalone, generation-charged Peak-Shift, or Cycle-mode project, the plant owes the load only inside its own discharge window: off-window hours carry no requirement, so nothing there can ever fall short. See How dispatch works for which hours count as a discharge window under each of those.
Setting the targets
Five independent targets, one per granularity above, live in the DFR Targets group on the 📐 Sizing tab. The 15-minute and Annual targets ship switched off, so no floor is enforced at either granularity unless you set one; Peak-hour, Off-Peak and Overall Monthly ship with a floor already in place. See Capacity and DFR targets for the exact fields, defaults and ranges.
Reading the monthly result
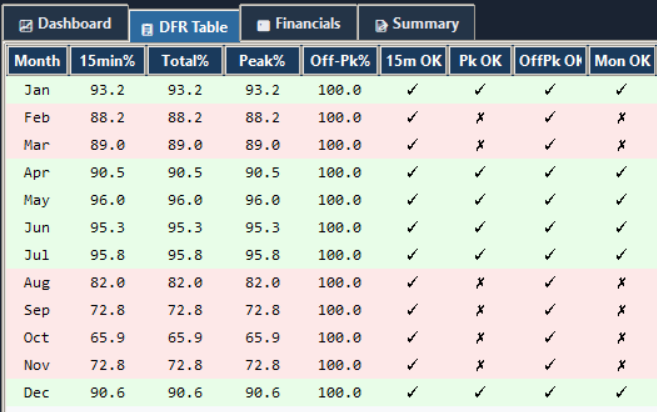
The 📋 DFR Table tab reports one row per calendar month of Year 1: that month's 15-minute, Overall, Peak and Off-Peak DFR percentages; whether each of the four met its target; the shortfall in MWh for Peak, Off-Peak and the 15-minute granularity; that month's penalty and its share of revenue; and the export energy and revenue for the month. A row is shaded green when Peak, Off-Peak, Overall and 15-minute DFR all met target that month, and red if any one of them didn't — so the colour down the tab alone tells you which months to look at first.
How a shortfall becomes a penalty
For each month, and separately for the Peak, Off-Peak, Overall and 15-minute buckets:
shortfall = max(target% × required MWh − delivered MWh, 0)
penalty   = penalty multiplier × PPA tariff × shortfall × 1000
That last ×1000 converts the MWh shortfall to kWh before it's priced at the tariff. A month's actual penalty is then the largest of three figures: the Peak penalty plus the Off-Peak penalty combined, the Overall (monthly) penalty on its own, and the 15-minute penalty on its own.
Penalty Multiplier and PPA Tariff are both set on the 📊 OPEX tab — see OPEX, revenue and penalties.
Where to go next
How dispatch works
The 15-minute annual simulation behind Simulate and Optimise, and the five rules that decide when the battery charges, discharges or idles.
The battery model
How usable energy, round-trip efficiency, C-rate and state of charge combine to decide how much energy the battery can move at each step.